

Traceroute Explorer
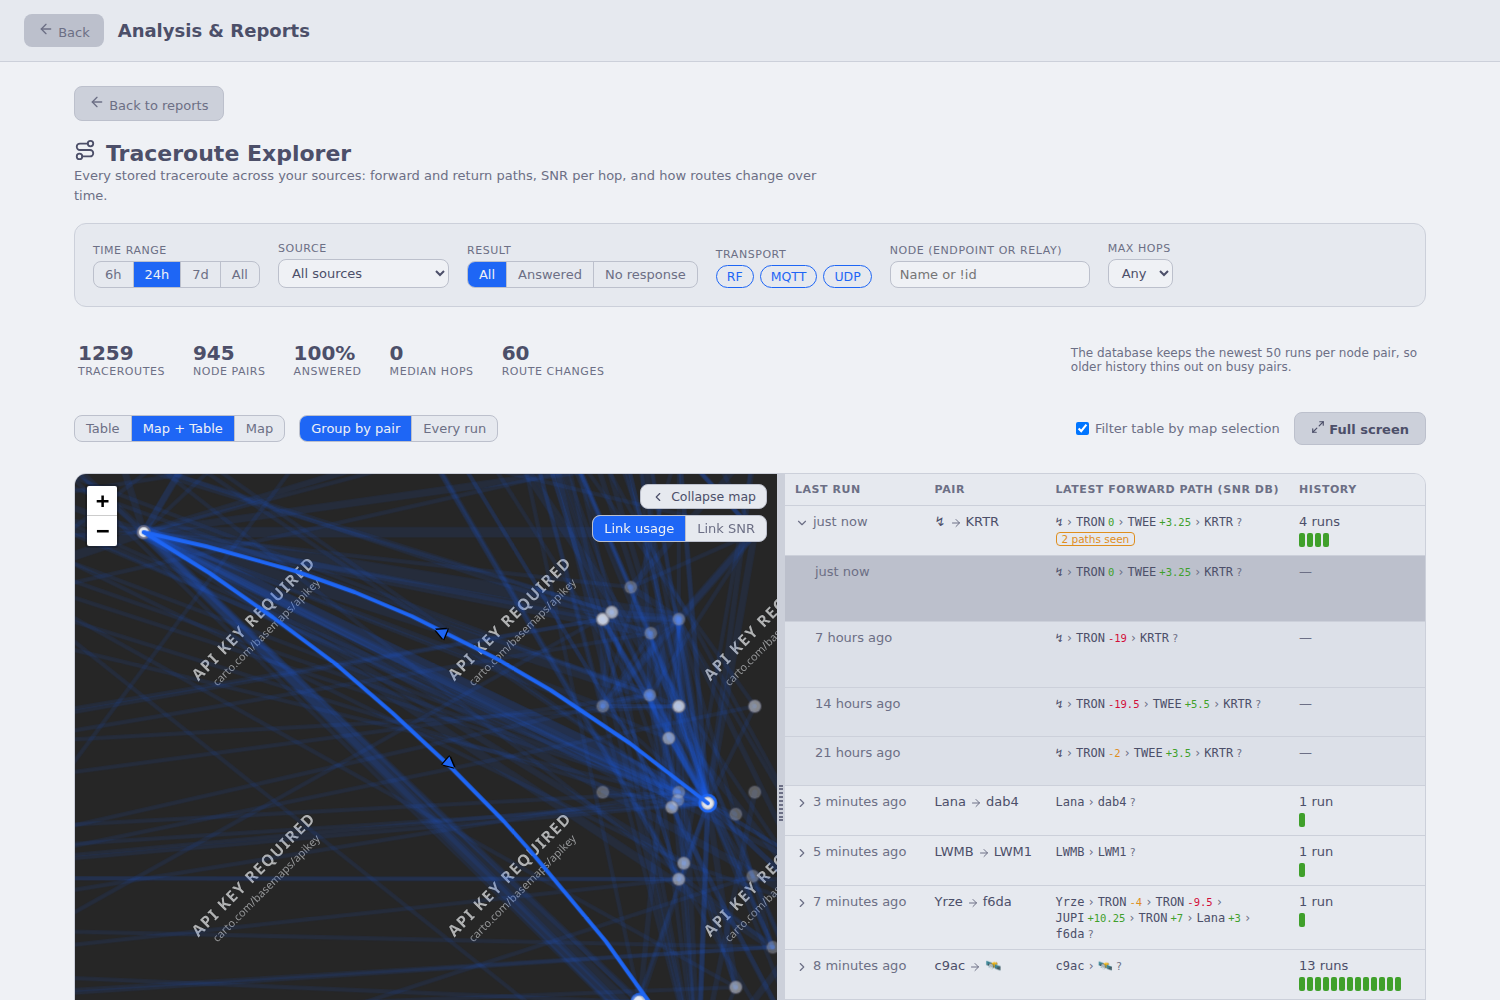
The Traceroute Explorer lists every traceroute MeshMonitor has stored, across every source you can read, on a linked map and table. Use it to audit how traffic actually moves through your mesh without opening each node's traceroute history one at a time.
Open it from Analysis & Reports (/reports) → Traceroute Explorer.
MeshMonitor sends nothing
This report sends zero packets. It only reads traceroutes already in the database: ones you or the auto-traceroute scheduler requested, and ones your sources overheard. It has no "run traceroute" button.
What you see
Filters
| Filter | What it does |
|---|---|
| Time range | 6h, 24h (default), 7d, or everything stored. Changing it reloads the data. |
| Source | One source, or all sources you can read. |
| Result | All runs, only Answered runs, or only runs with No response. |
| Transport | RF, MQTT and UDP, by the transport that carried the traceroute response. |
| Node | Name, short name or !id. Matches a node at either end of a run or anywhere on its path. |
| Max hops | Hide answered runs with more relays than this on the forward path. |
Every filter except the time range runs in your browser, so the map and table update at once.
Summary bar
Traceroutes, node pairs, the share that got an answer, median relay count, and how many runs took a different forward path from the pair's previous answered run.
Layout
Pick Table, Map + Table (default) or Map. The choice is saved in your browser.
- In Map + Table, drag the divider (or focus it and use the arrow keys) to resize the panes. On a phone the map stacks above the table.
- Collapse map shrinks the map to a thin rail so the table gets the full width. Show map on the rail brings it back.
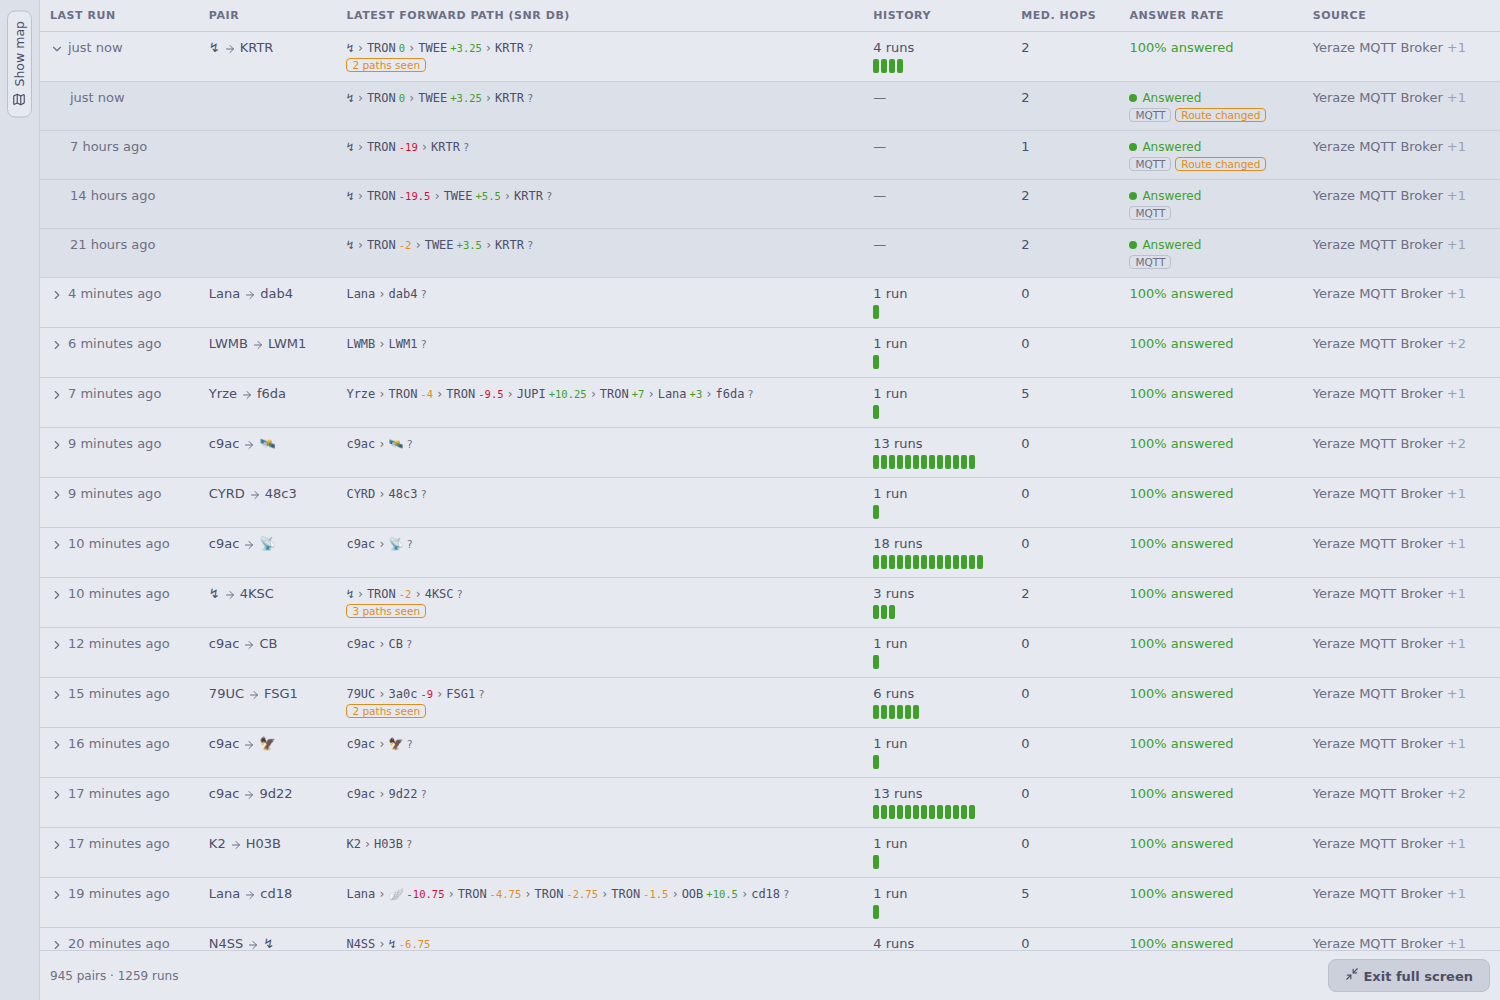
- Full screen fills the browser window with the map and table. Press Esc or Exit full screen to go back.
Table
- Group by pair (default) shows one row per origin → destination pair: when it last ran, its latest forward path with the SNR at each hop, a strip of recent results (green answered, red no response), median relays, and the answer rate. A paths seen tag means the pair has used more than one route. Click a pair to list its runs.
- Every run lists runs one per row, 200 at a time.
Runs carry tags for their transport, Route changed (the forward path differs from the pair's previous answered run) and Asymmetric (the return path is not the forward path reversed).
SNR colours: green at 0 dB or better, amber from −7 to 0 dB, red below −7 dB, grey when the hop reported no SNR (often an MQTT or UDP hop).
When two of your sources stored the same traceroute (same packet), it shows once, listing both sources.
Map
- With nothing selected, the map draws every node-to-node link the filtered runs used. Thicker lines carried more traceroute hops. Link SNR recolours the lines by the median SNR measured on each link.
- Hover a run in the table to preview it on the map; click to pin it. The forward path and return path draw in different colours with arrows.
- Click a node to show only runs through that node; a Through … chip appears under the filters. Untick Filter table by map selection to keep the table unfiltered while you click around the map.
Nodes appear only where you are allowed to see their position. A node whose position is on a channel you cannot view keeps its name in the table but has no marker.
Detail drawer
Selecting a run shows its hop-by-hop strip, copy links for the forward and return paths, a Pair history button that opens the full stored history for that pair, and a bar chart of every forward path the pair has used in the loaded window.
Limits
- Retention: MeshMonitor keeps the newest
TRACEROUTE_HISTORY_LIMITruns per node pair (default 50) and prunes old traceroutes by age, so busy pairs thin out over time. The summary bar shows the current limit. - Window size: one load reads at most 20,000 stored rows, newest first. A traceroute that several sources stored counts once per source, so on a busy multi-source install that is a few days. If a window holds more, a banner says so; pick a shorter time range.
- Meshtastic only: MeshCore path discovery does not store traceroutes in this table.
Permissions
GET /api/traceroutes/explorer scopes everything to the sources where you hold traceroute:read (admins see every enabled source):
- Runs on a channel you cannot view on the map are left out, the same rule the per-source traceroute views apply.
- Node names and positions also need
nodes:readon that source. Withtraceroute:readalone you see the runs, labelled by node id. - Node positions come only from node rows you can see on the map.
- A caller with no grants gets an empty list, not an error.
API
GET /api/traceroutes/explorer?hours=24&sources=id1,id2
| Param | Meaning |
|---|---|
hours | Optional window, 1 to 8760. Omit for everything stored. |
sources | Optional comma-separated source ids, intersected with the ones you can read. |
Response ({ success: true, data }):
sources:[{ id, name }]searched.runs: newest first; each hasid,sourceId,timestamp,fromNodeNum,toNodeNum, the storedroute/routeBack/snrTowards/snrBackJSON strings (SNR in raw dB × 4),channel,packetIdandtransportMechanism.nodes: one entry per node the runs mention:nodeNum,nodeId,shortName,longName,role,hwModel,latitude,longitude.truncated,scanLimit(20000 stored rows),retentionPerPair.
Errors: INVALID_HOURS (400), TRACEROUTE_EXPLORER_FAILED (500).