
Packet Monitor
The Packet Monitor is a diagnostic tool that displays raw Meshtastic packets as they are received from the mesh network. It provides visibility into the low-level packet traffic for debugging and analysis purposes.
MeshCore Packet Monitor
MeshCore sources have their own equivalent — the OTA Packet Monitor accessible from the Packets tab in the MeshCore source page. It captures raw OTA frames from the companion's LogRxData push (route type, payload type, relay chain, SNR/RSSI, and a full hex dump). See the MeshCore documentation for details.
MQTT Packet Monitor
MQTT sources (mqtt_broker and mqtt_bridge) also have their own gateway-aware equivalent — see MQTT sources below.
ATAK / CoT Integration
The ATAK_PLUGIN, ATAK_PLUGIN_V2, and ATAK_FORWARDER rows below are one piece of a larger integration — ATAK contacts also render on MeshMonitor's maps, and a streaming CoT feed can expose MeshMonitor as an ATAK/WinTAK network input. See ATAK / CoT Integration for the full picture.
Accessing the Packet Monitor
The Packet Monitor is available in two locations:
- Sidebar tab — Click the Packet Monitor icon in the sidebar for a full-page view
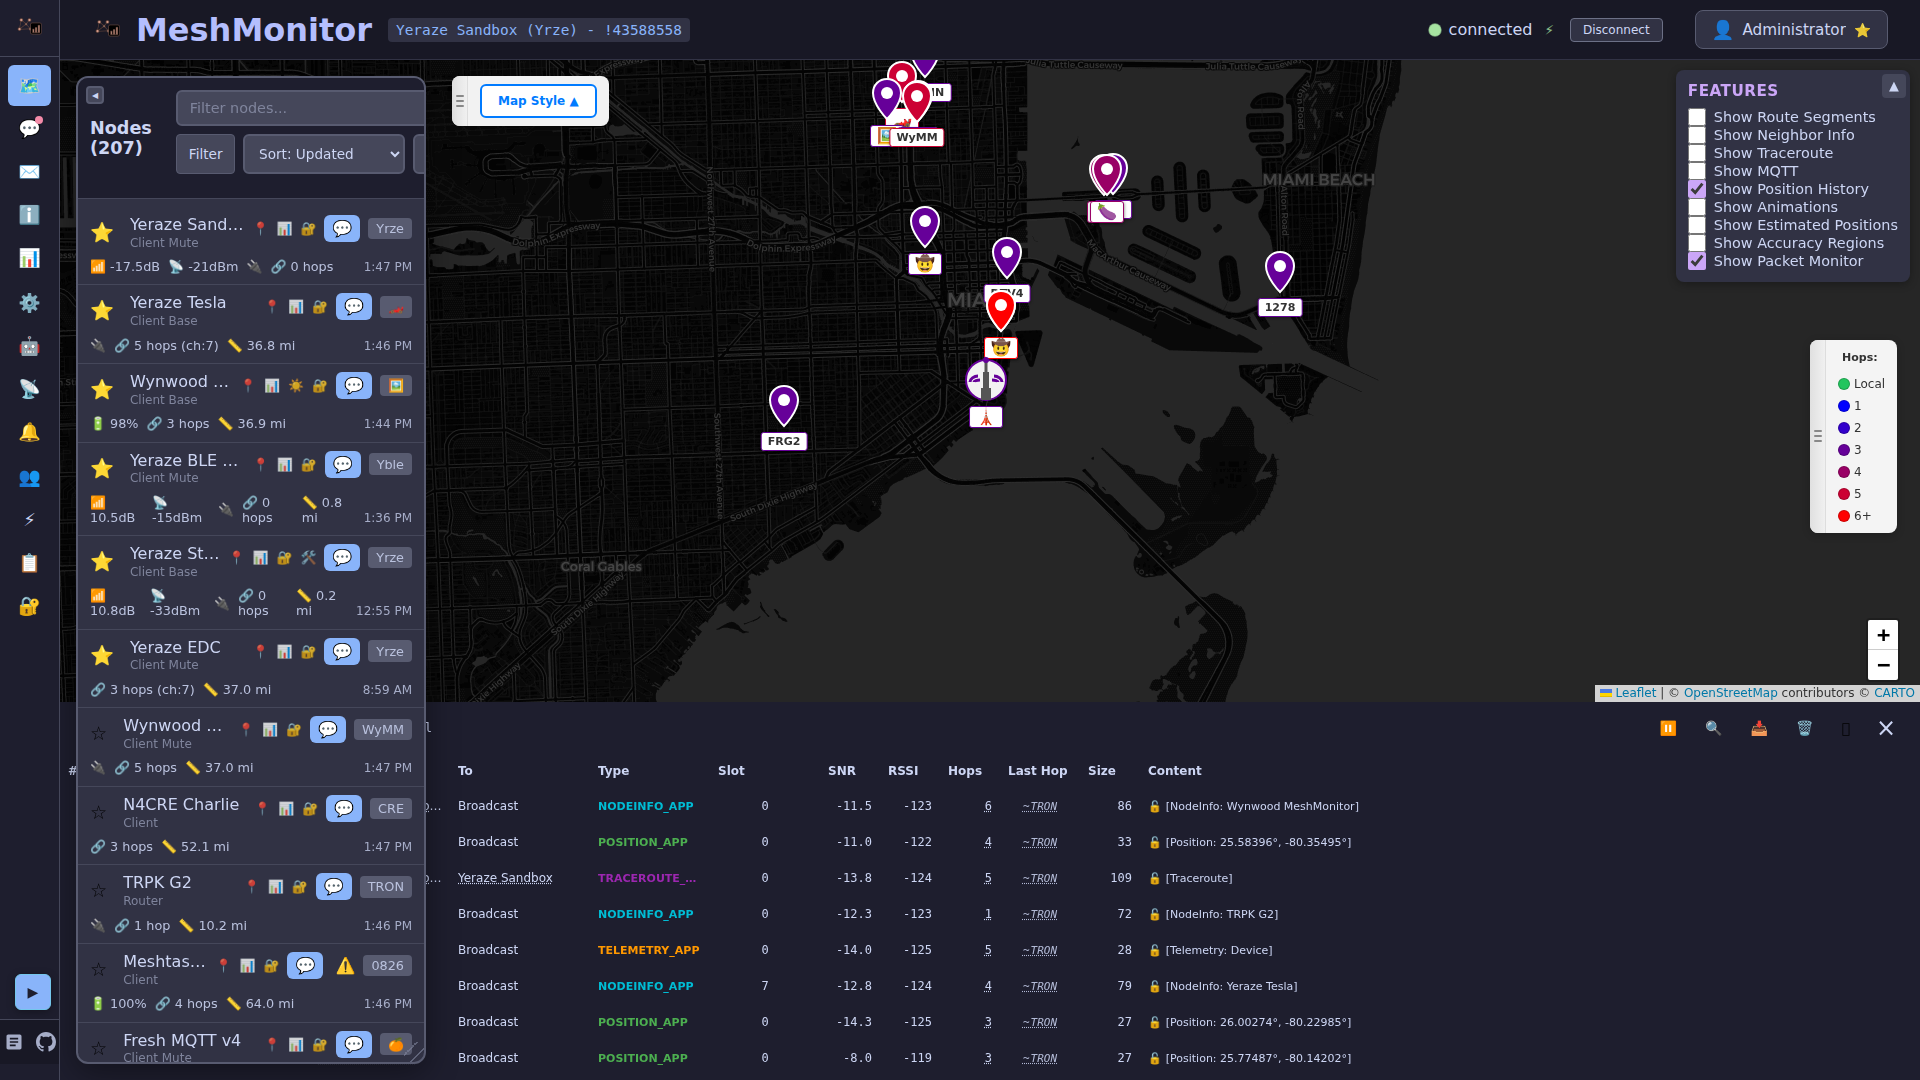
- Map panel — The Packet Monitor also appears at the bottom of the Map tab
Both views require the packetmonitor:read permission and must be enabled in Settings.
What the Packet Monitor Shows
Incoming Packets Only
The Packet Monitor displays only incoming packets received from the mesh network. It acts as a "radio sniffer" showing what your node hears over the air, not what MeshMonitor transmits.
Packets That Appear
| Packet Type | Description |
|---|---|
| TEXT_MESSAGE (1) | Text messages received from other nodes |
| POSITION (3) | GPS position updates from nodes |
| NODEINFO (4) | Node information broadcasts |
| ROUTING (5) | Routing acknowledgments and errors |
| ADMIN (6) | Administrative messages |
| PAXCOUNTER (34) | Paxcounter telemetry |
| TELEMETRY (67) | Device/environment telemetry |
| TRACEROUTE (70) | Traceroute responses |
| NEIGHBORINFO (71) | Neighbor information |
| MESH_BEACON (37) | Firmware 2.8+ periodic beacon advertising a joinable channel (name/preset) — early preview, decoded as [MeshBeacon: "..."] |
| ATAK_PLUGIN (72) | ATAK (Team Awareness Kit) plugin packets — decoded as [ATAK PLI ...] (position), [ATAK GeoChat ...] (chat, also delivered to Messages), [ATAK detail ...], or [ATAK GeoChat receipt]; full decoded TAKPacket in the detail view |
| ATAK_PLUGIN_V2 (78) | ATAK V2 (firmware 2.8+ rich CoT, zstd-compressed) — shown as [ATAK V2 (not decoded), N bytes]; decoding is a planned follow-up |
| ATAK_FORWARDER (257) | Third-party ATAK Forwarder packets — identified by name, not decoded |
Signed-packet shield (firmware 2.8 early preview)
Packets carrying a firmware-verified XEdDSA signature (Meshtastic's new packet-signing scheme, not yet in an official release) show a small shield icon next to the entry. This only reflects what the connected node itself reported as verified — MeshMonitor doesn't re-verify the signature.
Packets That Do NOT Appear
The following packets are not logged to the Packet Monitor:
Outgoing packets sent by MeshMonitor:
- Outgoing text messages - Messages you send via the chat interface
- Outgoing traceroute requests - Traceroutes initiated manually or by Auto Traceroute
- Outgoing position requests - Position exchange requests
- Auto-acknowledge responses - Automated replies sent by MeshMonitor
- Auto-welcome messages - Welcome messages sent to new nodes
- Auto-announcements - Scheduled announcement messages
Internal management packets (to/from local node):
- ADMIN_APP (6) - Administrative packets for local device configuration
- ROUTING_APP (5) - Routing acknowledgments to/from your connected node
These internal packets are filtered to reduce noise and keep the log focused on actual mesh traffic. ADMIN and ROUTING packets between remote nodes on the mesh are still logged.
This is by design - the Packet Monitor shows mesh network traffic, not MeshMonitor's internal operations or local device management.
Filtering Packets
Use the packet type dropdown to filter by specific packet types (portnums). Common filters include:
- All Types - Show all received packets
- TEXT_MESSAGE - Show only text messages
- POSITION - Show only position updates
- TELEMETRY - Show only telemetry data
- TRACEROUTE - Show only traceroute responses
- NODEINFO - Show only node information packets
Traceroute Filter
If you filter on TRACEROUTE and see no results, this likely means no traceroute operations have been performed on your mesh recently. Traceroute packets only appear when:
- A node on your mesh initiates a traceroute
- The traceroute response is received back
To see traceroute packets, initiate a traceroute from MeshMonitor's Node Details page or from another device on your mesh.
Packet Information
Each packet entry shows:
- Timestamp - When the packet was received
- From Node - The sending node's ID and name
- To Node - The destination (broadcast or specific node)
- Channel - The channel number
- Port Type - The Meshtastic portnum/application type
- SNR/RSSI - Signal quality metrics
- Hop Count - Number of hops the packet traveled
- Encrypted - Whether the packet was encrypted
- Payload Preview - A summary of the packet contents
Permissions
Access Permission
Viewing the Packet Monitor requires the packetmonitor:read permission. This is granted by default to all users (including Anonymous). Administrators can revoke it per-user in Settings > Users. The Packet Monitor permission is read-only — there is no write mode.
Packet Filtering by Permission
Once a user has access to the Packet Monitor, the packets they see are filtered based on their other permissions:
| Packet Type | Permission Required |
|---|---|
| Encrypted packets | None — always visible (content is unreadable) |
| Decrypted channel packets | channel_N:read for the packet's channel (0-7) |
| Direct Messages (TEXT_MESSAGE_APP to a specific node) | messages:read (Node Details & DM: Read) |
| Other decrypted packets (POSITION, TELEMETRY, etc.) | channel_N:read for the packet's channel |
| Packets with no channel info | Always visible |
Admin users bypass all filtering and see all packets.
Example
A user with packetmonitor:read, channel_0:read, and channel_1:read (but no messages:read) will see:
- All encrypted packets
- Decrypted packets on channels 0 and 1
- Non-DM packets on channels 0 and 1
- Not direct message text packets (they need
messages:readfor those)
MQTT sources
MQTT sources (mqtt_broker and mqtt_bridge) render a different, gateway-aware Packet Monitor on the same tab. MQTT's defining trait is that a single mesh packet can be relayed to the broker by multiple gateway nodes, each publishing its own copy with its own reception time, RSSI, SNR, and hop counts — so the MQTT view is built around deduplicating those copies back into one packet per entry while still exposing every gateway's reception details.
Deduplicated packet list
The main table shows each packet once, regardless of how many gateways relayed it, with a Gateways column giving the number of distinct gateways that reported it (and a Receptions count in the tooltip for the total number of copies received). Clicking a row opens a detail view listing every gateway that received the packet, with that gateway's specific time, RSSI, SNR, and computed hop count (hopStart - hopLimit) for that reception.
Gateway filter
Use the Gateways dropdown in the filter panel to narrow the list to packets heard by one or more specific gateways (multi-select, with Select all / Clear affordances). Gateways are labeled with their resolved node name when the gateway is present in the node list for the source, otherwise by their hex gateway ID. When a gateway filter is active, the Gateways column and filter panel note that the count reflects only the selected gateways, not the packet's full gateway set.
Capture opt-in and retention
Like the MeshCore OTA Packet Monitor, MQTT packet capture is opt-in — enable it from the banner shown when capture is off, or from the filter panel (requires settings:write). Capture is controlled by the mqtt_packet_log_enabled setting, with retention governed by mqtt_packet_log_max_count (default 5000 rows — higher than the other monitors because each row is one gateway reception, not one packet) and mqtt_packet_log_max_age_hours (default 24 hours).
Encrypted, ignored, and geo-ignored copies are still captured
The MQTT capture records every copy that reaches ingestion, not just packets that were successfully decoded — including copies that could not be decrypted, copies dropped by geo-ignore filtering, and copies with an unsupported portnum. These are flagged with an outcome badge (encrypted, ignored, geo-ignored, unsupported-portnum, or decode-error) in place of the decoded packet type, so the monitor stays useful for diagnosing why a packet's contents aren't visible elsewhere in MeshMonitor.
ok_to_mqtt violation detection
Every Meshtastic packet carries an ok_to_mqtt bit (bit 0 of Data.bitfield) by which the originating node signals whether it consents to its traffic being relayed to MQTT. Firmware only enforces this bit when a gateway relays someone else's packet, and it skips the check entirely whenever the gateway believes its configured broker address is private — a check that is a plain IP-range test with no awareness of NAT or port forwarding. A gateway reaching its broker through a LAN-literal address that is also port-forwarded to the internet gets misclassified as private, and will silently relay opted-out traffic to what is effectively a public broker.
MeshMonitor detects this condition: when a received MQTT packet's ok_to_mqtt bit is explicitly clear and the publishing gateway is not the packet's originator, that is a provable, confirmed violation, and MeshMonitor records it. A packet whose bit cannot be read at all — because the field was never set, or because the packet is encrypted and MeshMonitor has no matching channel key — is recorded only as unknown/suspected, never as a confirmed violation.
Not necessarily malicious
The overwhelmingly likely cause of a detected violation is the firmware misconfiguration described above — a gateway whose broker address merely looks private but isn't — not a deliberate attempt to bypass a node's opt-out. Treat a violation as a configuration issue worth flagging to the gateway operator, not as evidence of hostile intent.
Settings
Violation detection is controlled by three settings, all with working defaults out of the box — no configuration is required to start collecting violation history:
| Setting | Default | Description |
|---|---|---|
mqtt_oktomqtt_violation_log_enabled | ON | Kill switch for recording violations. Unlike mqtt_packet_log_enabled (opt-in, default off), this setting is on by default: set it to 0 to disable violation logging; any other value — including leaving it unset — keeps it on. |
mqtt_oktomqtt_violation_retention_days | 90 | How long a confirmed violation record is retained. |
mqtt_oktomqtt_violation_max_count | 50000 | Maximum number of violation records retained per source before the oldest are trimmed. |
Retention is independent of the Packet Monitor
Confirmed violations are stored in their own record set with their own retention policy — 90 days / 50,000 records per source — deliberately independent of the Packet Monitor's much shorter window (24 hours / 5,000 rows, see Capture opt-in and retention above) and of whether MQTT packet capture is enabled at all. Violation history is therefore retained even on installs that never turn on the MQTT Packet Monitor, and isn't lost when the packet log trims itself daily.
Forward-only detection
Violation detection only covers MQTT traffic received after upgrading to a MeshMonitor version with this feature. There is no backfill: the ok_to_mqtt bit was never previously stored, so there is nothing to retroactively re-evaluate for packets received before the upgrade — an old row can't be distinguished from a genuinely unreadable one, so guessing would only produce wrong answers. Expect an empty violation history immediately after upgrading; it fills in as new MQTT traffic arrives.
Current availability
This is currently a backend-only capability: violations are detected and recorded, but there is no user interface for them yet. A violation badge on Packet Monitor rows and a searchable gateway violation report under Analysis & Reports are planned for a future release.
Use Cases
The Packet Monitor is useful for:
- Debugging connectivity issues - See if packets are being received
- Analyzing mesh traffic patterns - Understand what types of traffic flow through your node
- Verifying encryption - Check which packets are encrypted vs unencrypted
- Signal quality analysis - Monitor SNR/RSSI values over time
- Troubleshooting packet delivery - Verify packets are reaching your node