
Interactive Maps
MeshMonitor provides powerful interactive mapping capabilities to visualize your mesh network in real-time. View node positions, track movement, analyze signal strength, and customize your map experience with flexible tile server options.
Overview
The interactive map is the primary visualization tool in MeshMonitor, displaying:
- Node Positions: Real-time GPS locations of all nodes in your network
- Signal Strength: Color-coded indicators showing network quality (SNR)
- Network Topology: Visual connections between nodes
- Node Status: Active, inactive, and flagged nodes with distinct markers
- Traceroute Paths: Visual representation of message routing paths
- Custom Markers: User-defined waypoints and points of interest
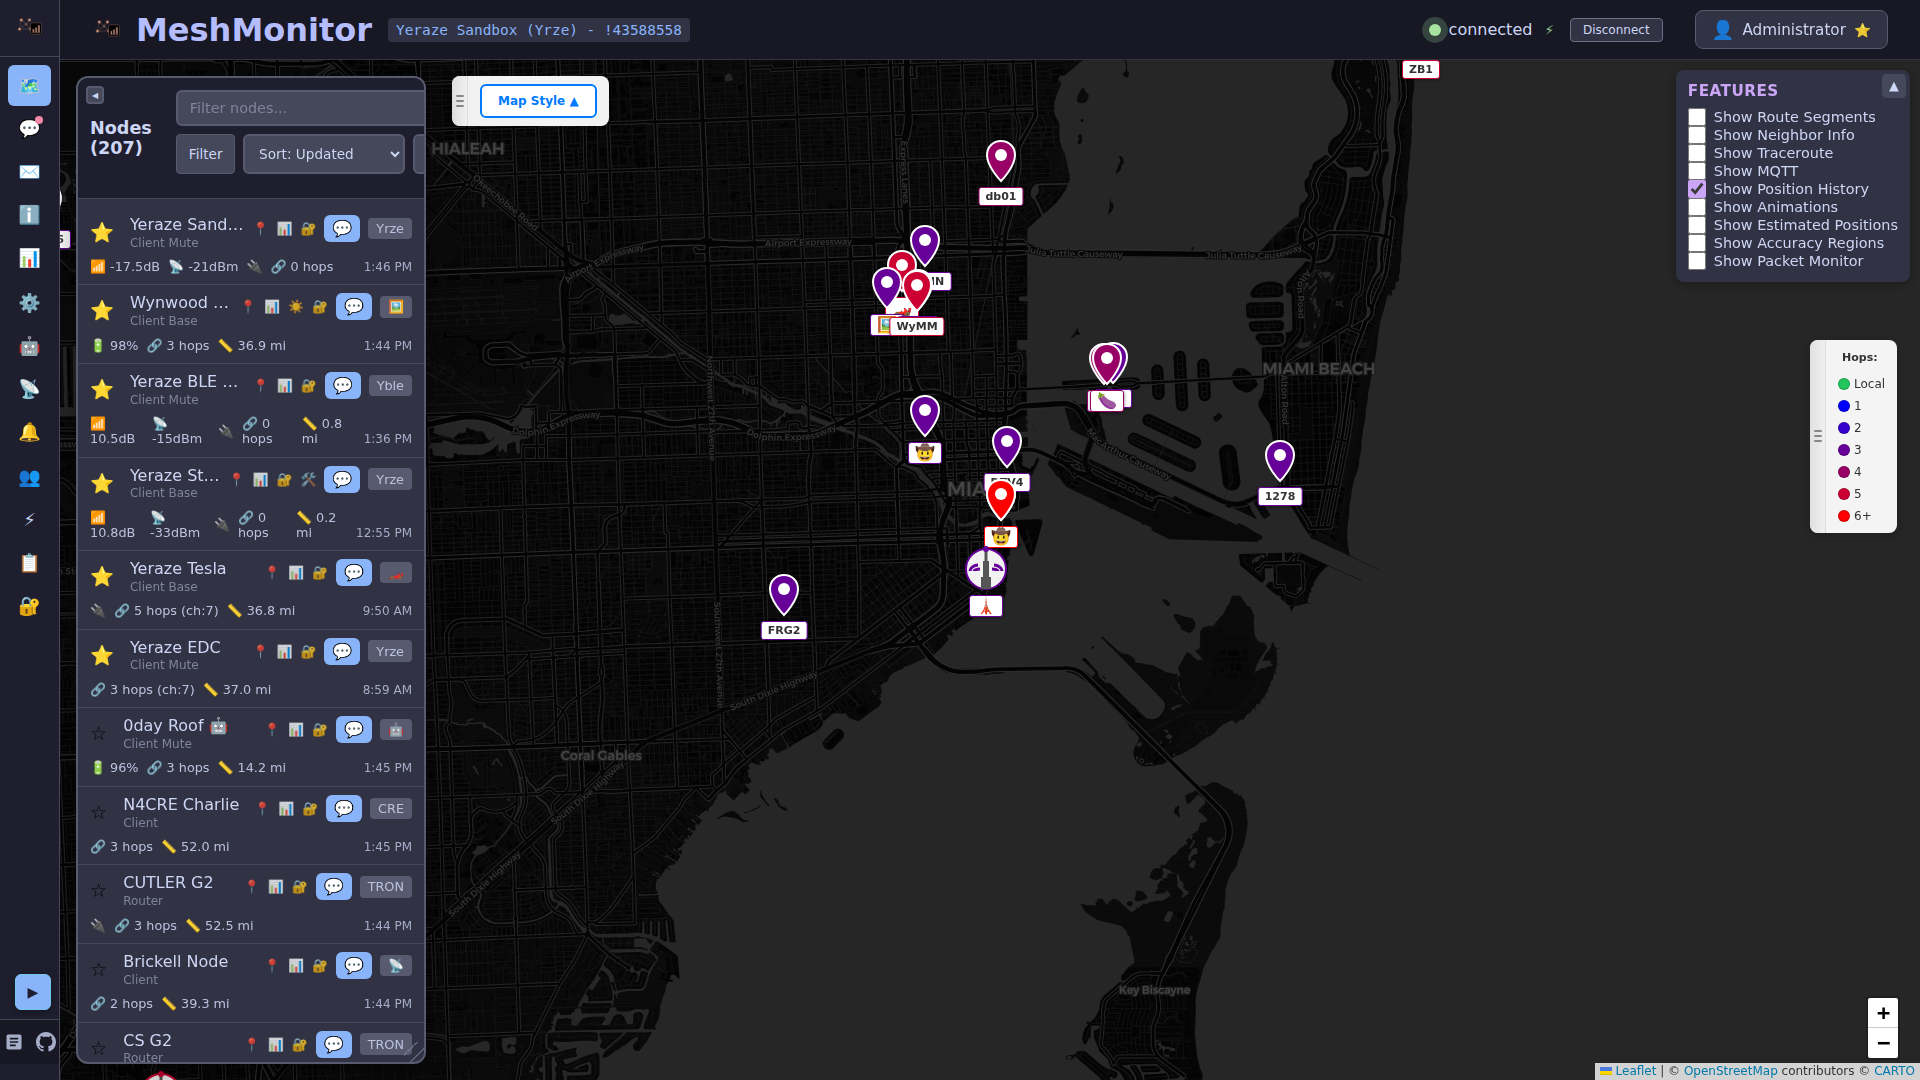
Map Features
Node Visualization
Node Markers
Each node is represented on the map with a marker that provides visual information:
Color Coding by SNR (Signal-to-Noise Ratio):
- 🟢 Green: Excellent signal (SNR ≥ 5 dB)
- 🟡 Yellow: Good signal (SNR ≥ 0 dB, < 5 dB)
- 🟠 Orange: Fair signal (SNR ≥ -5 dB, < 0 dB)
- 🔴 Red: Poor signal (SNR < -5 dB)
- ⚫ Gray: No signal data available
Security Indicators:
- ⚠️ Warning icon: Node has security issues (low-entropy keys, duplicate keys)
- See Security Features for details
Status Indicators:
- Solid marker: Active node (heard recently)
- Faded marker: Inactive node (not heard within configured time window)
Node Popups
Click any node marker to view detailed information:
- Node name (long name and short name)
- Node ID (hexadecimal and decimal)
- Hardware model with device image
- Battery level and voltage
- Signal quality (SNR and RSSI)
- Last heard timestamp
- Device role
- Firmware version
- Network position (hops away)
- Position accuracy (🎯) — a human-readable estimate derived from the node's reported GPS precision (e.g. "~91 m"), shown whenever the node broadcasts a non-full precision fix
- Location source (🛰️) — how the position was obtained: Manual, Internal GPS, or External GPS. Hidden when the node hasn't reported a source.
Map Controls
Zoom Controls
- Zoom In/Out: Use
+and-buttons or mouse wheel - Zoom Limits: Respects the max zoom level of your selected tileset
- Double-Click Zoom: Double-click to zoom in on a location
Layer Controls
- Tileset Selector: Bottom-center visual picker to switch between map styles
- Default Tilesets: OpenStreetMap, Satellite, Topographic, Dark/Light modes
- Custom Tilesets: Any configured custom tile servers appear in the selector
Per-theme tileset preferences (New in 4.13)
MeshMonitor remembers a separate tileset preference for light and dark appearance, so switching your color theme (e.g. Catppuccin Latte → Mocha) can also switch your map style automatically — a light OSM style while your UI is light, a dark CartoDB style once you flip to a dark theme, without picking the tileset again each time. Configure both in Settings → Map Settings (see below); the visual picker on the map always changes the tileset for whichever appearance is currently active.
Map Navigation
- Pan: Click and drag to move the map
- Center on Node: Click a node in the sidebar to center the map on that node. The map zooms in to a configurable target level (default 17, adjustable in Settings → Map) when the node is far away, but never zooms out below your current zoom level.
- Fit to Network: Automatically adjusts zoom to show all active nodes
Traceroute Visualization
When viewing traceroute data:
- Navigate to a node's details page
- View the Traceroute section
- Click "Show on Map" to visualize the routing path
- The map displays:
- Color-coded path segments showing hop sequence
- Arrows indicating message direction
- SNR indicators at each hop
- Failed routes shown in red
Channel Routing
For a traceroute to resolve every hop, each intermediate node must be able to decrypt the packet so it can append itself to the route. That depends on the channel's PSK, not its slot number. MeshMonitor therefore routes traceroutes over the lowest-numbered channel that the whole mesh can decrypt — one using the well-known default key (AQ==, what LongFast uses by default) or an unencrypted channel — rather than a hardcoded channel slot 0. If no channel is mesh-readable, it falls back to channel 0.
The Traceroute and Exchange Node Info actions in the messages/node UI are split buttons with a ▾ channel-selection dropdown (shown when more than one channel exists, mirroring the Exchange Position control). Use it to override the default and send on a specific channel.
Waypoints
Waypoints — Meshtastic's WAYPOINT_APP pins — render directly on the per-source dashboard map and the Map Analysis canvas, using each waypoint's emoji as its icon. Users with waypoints:write can create, edit, and delete waypoints in place from the Map Features panel. The same panel has a Show Waypoints checkbox (default on) that toggles waypoint marker visibility per-user — persisted alongside the other map feature toggles. See the dedicated Waypoints page for the full workflow, permissions, and REST API.
Estimated Positions & Accuracy
For nodes that never report GPS, MeshMonitor can plot an estimated position derived from traceroute and NeighborInfo geometry. Two Map Features toggles control the display:
- Show Estimated Positions — shows the estimated node markers.
- Show Accuracy — shows the dashed uncertainty circle around each estimated node (and the precision-bits accuracy regions for GPS nodes). The circle radius reflects how confidently the node could be placed.
Estimation itself is configured in Global Settings → Position Estimation, including a Maximum acceptable accuracy cutoff that discards low-confidence guesses. See the dedicated Position Estimation page.
Map Tilesets
Built-in Tilesets
MeshMonitor includes several pre-configured map styles:
OpenStreetMap (Default)
- Style: Standard OSM map with street and place names
- Max Zoom: 19
- Use Cases: General-purpose mapping, urban areas
- URL:
https://tile.openstreetmap.org/{z}/{x}/{y}.png - Attribution: © OpenStreetMap contributors
OpenStreetMap HOT
- Style: Humanitarian OpenStreetMap Team style
- Max Zoom: 19
- Use Cases: Disaster response, humanitarian operations
- URL:
https://tile.openstreetmap.fr/hot/{z}/{x}/{y}.png - Attribution: © OpenStreetMap contributors, Tiles courtesy of HOT
Satellite (ESRI)
- Style: Satellite imagery
- Max Zoom: 18
- Use Cases: Identifying terrain features, physical landmarks
- URL:
https://server.arcgisonline.com/ArcGIS/rest/services/World_Imagery/MapServer/tile/{z}/{y}/{x} - Attribution: Tiles © Esri
OpenTopoMap
- Style: Topographic map with contour lines and elevation data
- Max Zoom: 17
- Use Cases: Outdoor deployments, terrain analysis, hiking
- URL:
https://tile.opentopomap.org/{z}/{x}/{y}.png - Attribution: © OpenStreetMap contributors, SRTM
CartoDB Dark Matter
- Style: Minimalist dark theme
- Max Zoom: 19
- Use Cases: Dark mode displays, nighttime viewing
- URL:
https://cartodb-basemaps-a.global.ssl.fastly.net/dark_all/{z}/{x}/{y}.png - Attribution: © OpenStreetMap contributors, © CartoDB
CartoDB Positron (Light)
- Style: Minimalist light theme
- Max Zoom: 19
- Use Cases: Clean, minimal map display
- URL:
https://cartodb-basemaps-a.global.ssl.fastly.net/light_all/{z}/{x}/{y}.png - Attribution: © OpenStreetMap contributors, © CartoDB
Custom Tile Servers
MeshMonitor supports adding your own custom tile servers for:
- Offline Operation: Host tiles locally for complete offline functionality
- Privacy: Prevent third-party tile requests from leaking node locations
- Custom Branding: Organization-specific map styles
- High Availability: Independence from external tile services
- Specialized Maps: Aviation charts, nautical charts, custom overlays
Supported Tile Types
Vector Tiles (Client-side rendered):
- File Extensions:
.pbf,.mvt - Rendering: Automatic client-side rendering using MapLibre GL
- Advantages:
- ✅ 5-10x smaller storage than raster tiles
- ✅ Flexible styling (can adjust colors dynamically)
- ✅ Sharp at any zoom level
- ✅ Scales beautifully without pixelation
- Disadvantages:
- ⚠️ Slightly higher CPU usage for rendering
- ⚠️ Limited to max zoom 14 by default
Raster Tiles (Pre-rendered images):
- File Extensions:
.png,.jpg,.jpeg,.webp - Rendering: Browser displays pre-rendered images
- Advantages:
- ✅ No client-side rendering overhead
- ✅ Works with any tile server or static hosting
- ✅ Predictable performance
- ✅ Can support higher zoom levels (18-19)
- Disadvantages:
- ❌ 5-10x larger storage than vector tiles
- ❌ Fixed styling (can't change appearance)
Quick Setup Examples
For Vector Tiles (.pbf):
Name: Local Vector Tiles
URL: http://localhost:8080/data/v3/{z}/{x}/{y}.pbf
Attribution: © OpenStreetMap contributors
Max Zoom: 14For Raster Tiles (.png):
Name: Local Raster Tiles
URL: http://localhost:8080/styles/basic/{z}/{x}/{y}.png
Attribution: © OpenStreetMap contributors
Max Zoom: 18For Nginx Caching Proxy:
Name: OpenStreetMap (Cached)
URL: http://localhost:8081/{z}/{x}/{y}.png
Attribution: © OpenStreetMap contributors
Max Zoom: 19
Description: OSM tiles with local cachingSee the Custom Tile Servers guide for complete setup instructions, deployment options, and troubleshooting.
Configuring Map Settings
Changing the Active Tileset
Method 1: Settings Tab
- Navigate to Settings → Map Settings
- Choose your desired tileset from the Light Mode Tileset and/or Dark Mode Tileset dropdowns — each applies only while the matching UI appearance is active
- Click Save Settings
- The map will reload with the new tileset
Method 2: Visual Selector (Nodes Tab)
- Navigate to the Nodes tab
- Locate the tileset selector at the bottom-center of the map
- Click to open the visual picker showing tileset previews
- Click your desired tileset
- The map immediately switches to the new tileset
Adding Custom Tile Servers
- Navigate to Settings → Map Settings → Custom Tile Servers
- Click + Add Custom Tile Server
- Fill in the required fields:
- Name: Friendly name (e.g., "Local Offline Tiles")
- Tile URL: URL template with
{z}/{x}/{y}placeholders - Attribution: Attribution text for the map source
- Max Zoom: Maximum zoom level (1-22)
- Description: Optional description
- Click Save
- Your custom tileset now appears in the tileset dropdown
Tile URL Format
Custom tile servers must use the standard XYZ tile format:
https://example.com/{z}/{x}/{y}.pngRequired Placeholders:
{z}- Zoom level (0-22){x}- Tile X coordinate{y}- Tile Y coordinate
Optional Placeholders:
{s}- Subdomain (e.g., a, b, c for load balancing)
Examples:
Local server:        http://localhost:8081/{z}/{x}/{y}.png
Subdomain-based:     https://{s}.tiles.example.com/{z}/{x}/{y}.png
Custom path:         https://maps.example.com/tiles/{z}/{x}/{y}.webp
Vector tiles: http://localhost:8080/data/v3/{z}/{x}/{y}.pbfOffline Map Operation
Why Offline Maps?
Offline maps are essential for:
- Remote Deployments: Areas without reliable internet connectivity
- Privacy-Sensitive Operations: Prevent third-party tile requests from leaking node locations
- Emergency Response: Maintain mapping capabilities during network outages
- High-Traffic Events: Avoid rate limits and service disruptions
- Cost Control: Reduce external API usage and bandwidth costs
Offline Deployment Options
Option 1: TileServer GL Light (Recommended)
Best for: True offline operation with pre-downloaded tiles
Supports: Both vector (.pbf) and raster (.png) tiles
Setup:
Download tiles (
.mbtilesformat):- Vector tiles: MapTiler OSM
- Raster tiles: OpenMapTiles Downloads
Place
.mbtilesfiles in./tilesdirectoryStart TileServer GL Light:
bashdocker run -d \ --name tileserver \ -p 8080:8080 \ -v $(pwd)/tiles:/data \ maptiler/tileserver-gl-light:latestAdd to MeshMonitor (see Quick Setup Examples above)
Advantages:
- ✅ Works completely offline
- ✅ No external dependencies
- ✅ Predictable performance
- ✅ No native library issues
Option 2: Nginx Caching Proxy
Best for: Gradual offline coverage without large upfront download
Supports: Raster tiles only
How it works:
- First request: Downloads from online source → saves to cache → serves to browser
- Subsequent requests: Serves from local cache (works offline)
- Over time: Builds offline coverage of frequently-viewed areas
Setup: See the Nginx Caching Tile Proxy section
Advantages:
- ✅ No large upfront download
- ✅ Gradually builds offline coverage
- ✅ Works online and offline
- ✅ Simple setup
Option 3: Directory Tiles with Static Web Server
Best for: Custom tile generation or specific area coverage
Supports: Raster tiles only
Setup:
- Generate tiles using QGIS QTiles plugin or tile-downloader
- Organize in Z/X/Y directory structure:
tiles/0/0/0.png tiles/1/0/0.png tiles/1/0/1.png ... - Serve with nginx, Apache, or any static web server
- Configure CORS headers to allow cross-origin requests
Advantages:
- ✅ Full control over tile generation
- ✅ Flexible server options
- ✅ Can customize tile rendering
Map Privacy and Security
Privacy Considerations
When using online tile servers:
- Location Leakage: Each tile request reveals the geographic area you're viewing
- Network Topology: Repeated requests can reveal node locations and network structure
- Third-Party Tracking: External tile servers may log IP addresses and request patterns
Recommended for Privacy:
- Use custom tile servers hosted on your network
- Deploy offline tiles for sensitive operations
- Use nginx caching proxy to minimize external requests
- Consider self-hosting TileServer GL on your infrastructure
Security Best Practices
HTTPS vs HTTP:
- HTTPS: Required for production deployments and internet-facing servers
- HTTP: Acceptable for localhost (127.0.0.1) or trusted internal networks only
- Mixed Content: HTTPS sites cannot load HTTP tiles (browser security policy)
CORS Configuration:
Custom tile servers must allow cross-origin requests. Configure your server:
Nginx:
add_header Access-Control-Allow-Origin *;Apache:
Header set Access-Control-Allow-Origin "*"Node.js/Express:
app.use((req, res, next) => {
  res.header('Access-Control-Allow-Origin', '*');
  next();
});URL Validation:
MeshMonitor validates tile URLs to prevent:
- Missing required placeholders (
{z},{x},{y}) - Invalid URL format
- Non-HTTP/HTTPS protocols
- Excessively long URLs (> 500 characters)
Troubleshooting
Tiles Not Loading (Gray Squares)
Symptoms: Map shows gray squares instead of map tiles
Solutions:
Check CORS headers:
bashcurl -I http://localhost:8080/tiles/0/0/0.png # Should include: Access-Control-Allow-Origin: *Verify tile server is running:
bashcurl http://localhost:8080/tiles/0/0/0.png # Should return image dataTest URL format:
- Ensure
{z},{x},{y}placeholders are present - Test with real values: replace
{z}with 0,{x}with 0,{y}with 0
- Ensure
Check browser console (F12 → Console tab):
- Look for CORS errors
- Look for 404 Not Found errors
- Check Network tab for failing requests
Mixed Content Warnings
Symptoms: Browser blocks HTTP tile requests on HTTPS site
Error Message: "Mixed Content: The page at 'https://...' was loaded over HTTPS, but requested an insecure resource 'http://...'"
Solutions:
- Use HTTPS for tile server (recommended for production)
- Use localhost/127.0.0.1 (allowed for development)
- Configure reverse proxy to serve tiles over HTTPS
Slow Tile Loading
Symptoms: Map loads slowly, tiles timeout, or appear gradually
Solutions:
- Use local tile server: Much faster than remote servers
- Reduce max zoom: Fewer high-resolution tiles to load
- Enable browser caching: Tiles are cached automatically by modern browsers
- Optimize tile size: Use WebP format for smaller file sizes
- Check network bandwidth: Slow internet affects external tile servers
- Use vector tiles: 5-10x smaller than raster tiles
Vector Tiles Not Rendering
Symptoms: Blank map or gray squares when using .pbf tiles
Solutions:
- Verify file extension: URL must end with
.pbfor.mvt - Check MapLibre GL: Ensure browser supports WebGL (all modern browsers do)
- Test tile URL directly: Open tile URL in browser, should download a binary file
- Check console errors: Look for WebGL or MapLibre errors in browser console
Custom Tileset Not Appearing in Dropdown
Symptoms: Added tileset doesn't show in the map tileset selector
Solutions:
- Refresh the page: Settings are loaded on page load
- Check save succeeded: Look for success message or error
- Verify URL format: Must include
{z},{x},{y}placeholders - Clear browser cache: Force reload with Ctrl+F5 (Cmd+Shift+R on Mac)
- Check browser console: Look for JavaScript errors
Performance Optimization
For Large Networks (100+ Nodes)
- Use vector tiles for smaller file sizes and better performance
- Set appropriate max node age to filter inactive nodes
- Consider clustering markers at low zoom levels (future feature)
- Use raster tiles with lower max zoom if vector rendering is slow
For Limited Bandwidth
- Use nginx caching proxy to build offline coverage gradually
- Choose raster tiles with lower resolution (max zoom 12-14)
- Use WebP format for 20-30% smaller file sizes
- Pre-download only necessary zoom levels
For Offline Deployments
- Use vector tiles for 5-10x smaller storage
- Download only necessary zoom levels (e.g., 0-14)
- Use regional extracts instead of full planet tiles
- Consider lower resolution tiles for large coverage areas
Advanced Usage
Subdomain Load Balancing
Distribute tile requests across multiple servers:
URL: https://{s}.tiles.example.com/{z}/{x}/{y}.pngConfigure DNS:
a.tiles.example.com→ Server 1b.tiles.example.com→ Server 2c.tiles.example.com→ Server 3
Benefits:
- Parallel tile loading (faster map rendering)
- Load distribution across servers
- Increased reliability
Retina/High-DPI Displays
For high-resolution displays, use @2x tiles:
URL: https://example.com/tiles/{z}/{x}/{y}@2x.pngNote: Adjust max zoom accordingly (typically max zoom - 1)
Custom Tile Formats
MeshMonitor supports various tile formats:
- PNG: Best quality, larger file size, supports transparency
- JPEG: Good for satellite imagery, no transparency, smaller file size
- WebP: Modern format, 20-30% smaller, excellent quality, modern browsers only
Example:
URL: https://example.com/tiles/{z}/{x}/{y}.webpLimits and Constraints
- Maximum Custom Tilesets: 50 per instance
- URL Length: 500 characters maximum
- Name Length: 100 characters maximum
- Attribution Length: 200 characters maximum
- Description Length: 200 characters maximum
- Zoom Range: 1-22 (practical limits depend on tile data availability)
Related Documentation
- Custom Tile Servers - Complete setup guide
- Settings - Map settings configuration
- Security Features - Understanding security indicators on the map
- Getting Started - Initial MeshMonitor setup
Best Practices
- Test locally first: Verify tiles load correctly before production deployment
- Use descriptive names: Make it easy to identify tilesets
- Include attribution: Give proper credit to tile data providers
- Set appropriate max zoom: Match your tile data's capabilities
- Monitor storage: Offline tiles can consume significant disk space
- Regular updates: Keep offline tiles current for map accuracy
- Backup configurations: Export custom tileset settings before major changes
- Choose the right tile type: Vector for flexibility and size, raster for compatibility
- Plan for offline: Pre-download tiles for areas you'll need offline
- Secure your tile server: Use HTTPS in production, restrict access if needed
Support and Feedback
For issues, questions, or feature requests:
- GitHub Issues: github.com/yeraze/meshmonitor/issues
- Documentation: MeshMonitor Docs
- Custom Tile Server Guide: Custom Tile Servers