
Link Quality & Smart Hops
MeshMonitor provides two complementary graphs for understanding the health and routing behavior of your mesh network connections: Link Quality and Smart Hops. Both are available in the Messages tab telemetry view and can be pinned to the Dashboard.
Link Quality
Link Quality is a real-time score from 0 to 10 that represents the reliability of communication with a node. It updates dynamically as messages are sent and received, giving you an at-a-glance view of connection health.
Quality Scale
| Score | Rating | Description |
|---|---|---|
| 9-10 | Excellent | Optimal, consistent connection |
| 7-8 | Good | Reliable connection |
| 4-6 | Moderate | Adequate but may have intermittent issues |
| 1-3 | Poor | Unstable, frequent drops or high latency |
| 0 | Dead | Link is not functional |
How It's Calculated
Link Quality starts with a base score derived from the hop count of the first message received from a node, then adjusts in real-time based on ongoing events:
- Stable or improved routing (+1): Message arrives with the same or fewer hops than before
- Degraded routing (-1): Message arrives with 2+ more hops than before
- Failed traceroute (-2): A traceroute request to the node times out
- PKI/encryption error (-5): Cryptographic validation failures indicate a serious link problem
The score is always clamped between 0 and 10.
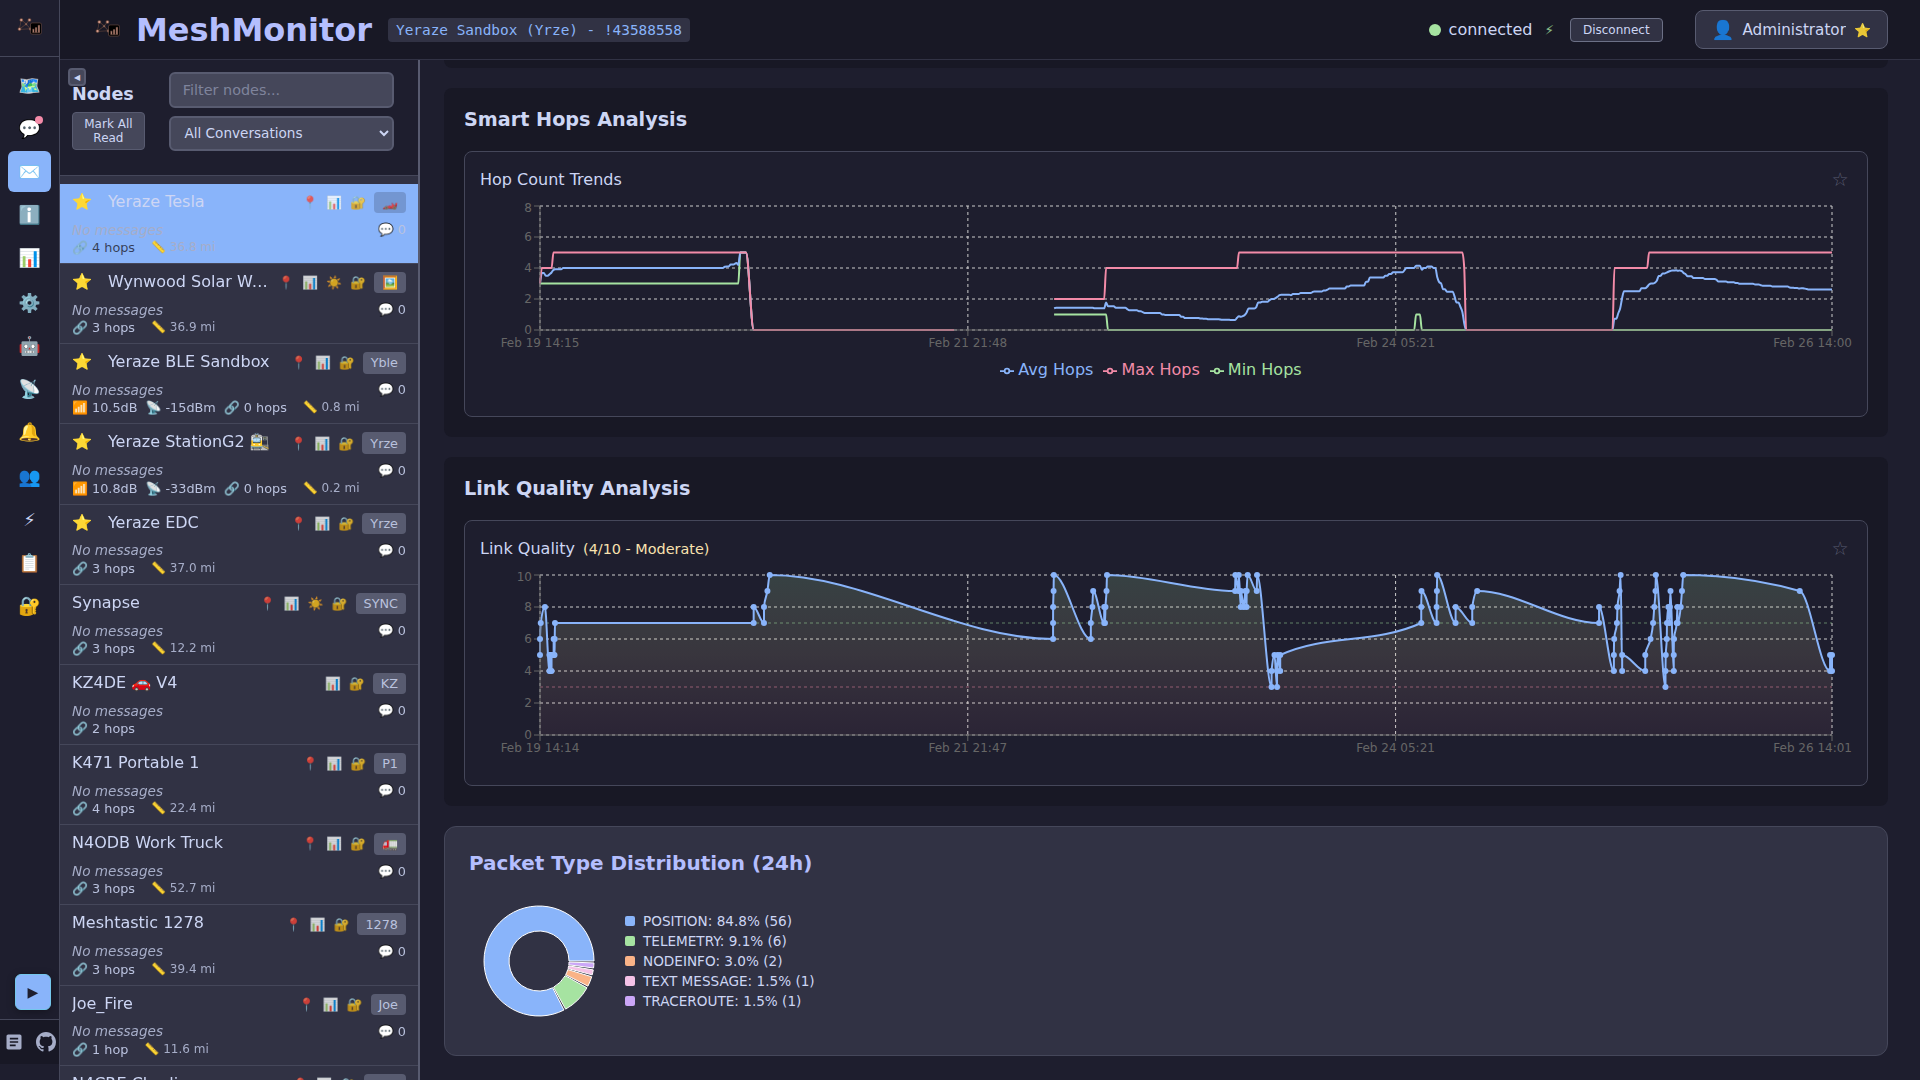
Chart Details
The Link Quality chart displays:
- A blue line showing quality over time
- A colored fill area underneath using a green-to-yellow-to-red gradient
- Reference lines at quality 3 (poor threshold) and 7 (good threshold)
- An interactive tooltip showing the exact timestamp, quality score, and descriptive label
The chart title shows the node name and current quality score (e.g., "NodeName - Link Quality (8/10)").
Smart Hops
Smart Hops provides a historical view of how many hops your messages actually take to reach a node. Unlike the simple "hops away" count from NodeInfo (which is a single snapshot), Smart Hops analyzes routing patterns over time using a rolling 24-hour window.
What It Shows
The chart displays three lines:
- Min Hops (green): The fewest hops seen in the rolling window
- Avg Hops (blue): The average hop count across all messages
- Max Hops (red): The most hops seen in the rolling window
Why It Matters
Smart Hops reveals trends that a single hop count cannot:
- Is routing degrading? If min/max/avg are all climbing, the network path is getting worse
- Is the path stable? A narrow gap between min and max means consistent routing
- Are there intermittent issues? A wide spread between min and max suggests the network is finding different paths for each message, which may indicate an unstable relay node
Chart Details
- Data points are generated at 15-minute intervals, each representing statistics from the preceding 24-hour window
- Gaps in data (breaks longer than 1 hour) are shown as visual disconnections rather than interpolated lines, so you can see when no messages were exchanged
- A legend at the bottom identifies the three lines
- An interactive tooltip shows exact hop counts at each time point
Viewing the Graphs
Messages Tab
- Navigate to the Messages tab
- Select a node from the conversation list
- Scroll down past the message history to the Telemetry section
- Link Quality and Smart Hops graphs appear alongside other telemetry data (battery, voltage, etc.)
Dashboard
Both graphs can be pinned to the Dashboard for at-a-glance monitoring:
- In the Messages tab telemetry view, click the star icon on either graph
- The graph will appear as a draggable widget on your Dashboard
- Dashboard widgets include a drag handle for reordering and a remove button
- All dashboard charts respect the global time range selector
Settings
Telemetry Visualization Hours
Controls how much historical data is displayed in the graphs.
- Location: Settings tab
- Default: 24 hours
- Range: 1 to 168 hours (7 days)
Node Hops Calculation
Controls how the hop count is determined for the node list display, map marker colors, and Messages node details (separate from Smart Hops):
- NodeInfo packet (default): Uses the
hopsAwayvalue from the node's most recent NodeInfo broadcast. This is the standard Meshtastic behavior and provides a stable, consistent hop count. - Traceroute length: Uses the shortest path found in traceroute results between your node and the target. Falls back to NodeInfo if no traceroute data is available.
- All messages: Uses the hop count from the most recent packet received from the node — any packet type, not just text messages. This includes telemetry, position, NodeInfo, text messages, traceroute responses, and all other packet types. The hop count is derived from the packet's
hopStart - hopLimitfields, which indicate how many relay hops the packet actually traversed. Falls back to NodeInfo if no message hop data is available.
TIP
Smart Hops always uses actual message hop counts regardless of this setting. The Node Hops Calculation setting only affects the hop count shown in the node list, map markers, and message node details.
Data Sources
Both features use the messageHops telemetry type, which is calculated from each incoming mesh message as hopStart - hopLimit. This represents the actual number of relay hops the message traversed to reach your node.
Link Quality additionally factors in traceroute results and encryption error events to provide a more complete reliability picture.
Signal Trend badge
New in 4.13
Don't confuse the Link Quality score above with the Signal Trend badge (▲ Improving / → Stable / ▼ Degrading) shown in the Node Details block on the Messages page. Signal Trend answers a narrower, RF-focused question: is this specific node's received signal getting weaker or stronger, day-over-week? It compares the last 24 hours of RSSI (falling back to SNR when RSSI history is sparse) against the preceding 7-day baseline, and calls out separately when a drop is attributable to a rising local noise floor rather than the link itself. Link Quality, by contrast, is a broader 0-10 reliability score driven by routing (hop-count changes, traceroute failures, encryption errors) rather than raw signal strength. Use Link Quality to judge overall reliability; use Signal Trend to judge whether the RF path itself is changing.