
🛰️
Multi-Protocol, Multi-Source
Connect Meshtastic (TCP, Serial, BLE), MeshCore, and MQTT brokers all at once — mix and match in one dashboard. Per-source maps, messages, telemetry, and traceroutes. No restart to add or remove a source.
Self-hosted multi-protocol mesh monitoring for Meshtastic, MeshCore, and MQTT — real-time maps, alerts, per-source permissions, and full network awareness.
Need a Custom Configuration?
Use our Interactive Configurator to generate a customized docker-compose.yml for your specific setup (TCP, BLE, Serial, reverse proxy, etc.).
Get MeshMonitor running in under 60 seconds with Docker Compose:
cat > docker-compose.yml << 'EOF'
services:
  meshmonitor:
    image: ghcr.io/yeraze/meshmonitor:latest
    container_name: meshmonitor
    ports:
      - "8080:3001"
    volumes:
      - meshmonitor-data:/data
    environment:
      - MESHTASTIC_NODE_IP=192.168.1.100  # Seeds the first source on first boot; add more from Dashboard → Sources
      - ALLOWED_ORIGINS=http://localhost:8080  # Required for CORS
    restart: unless-stopped

volumes:
  meshmonitor-data:
EOF

docker compose up -dAccess at http://localhost:8080 and login with username admin and password changeme.
That's it! No SESSION_SECRET or complex configuration needed for basic usage. MeshMonitor works over HTTP out of the box.
For production deployments, Kubernetes, reverse proxies, and advanced configurations, see the Production Deployment Guide.
MeshMonitor speaks three off-grid mesh ecosystems and treats them as peers in one deployment:
Pick one, mix all three — MeshMonitor's unified views, per-source permissions, and the same automation, telemetry, and map features apply to every source you add.
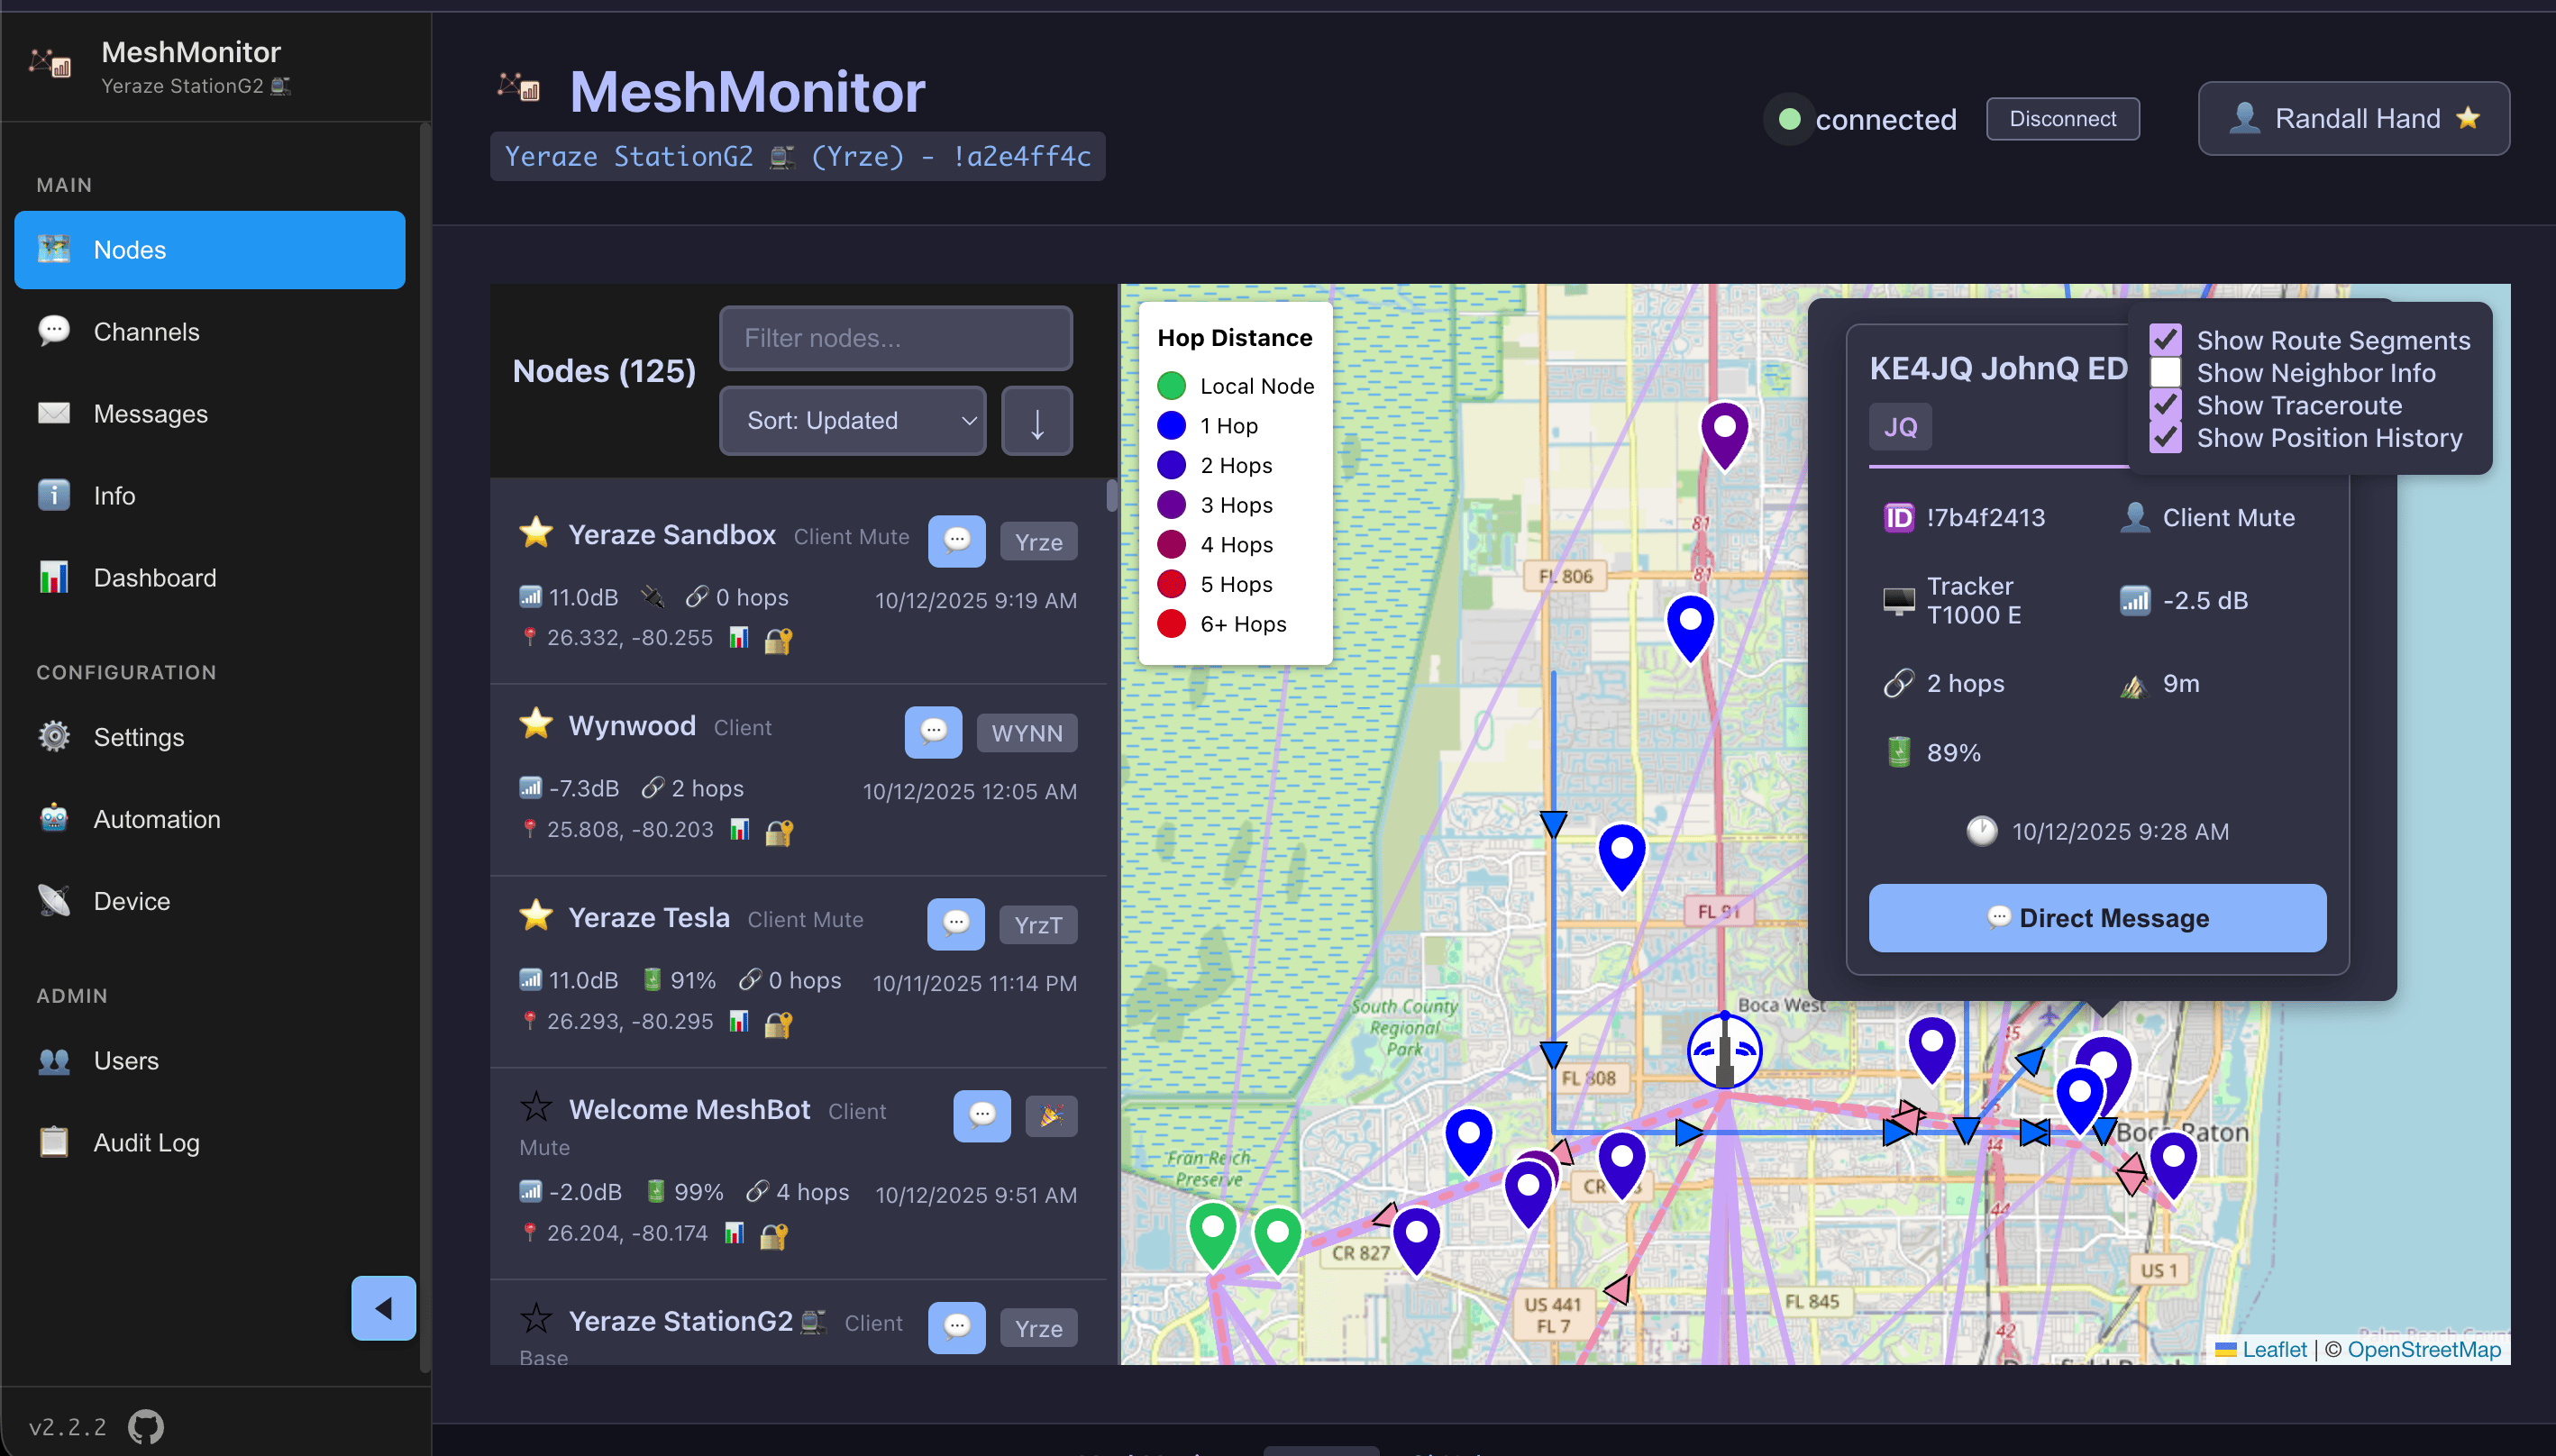
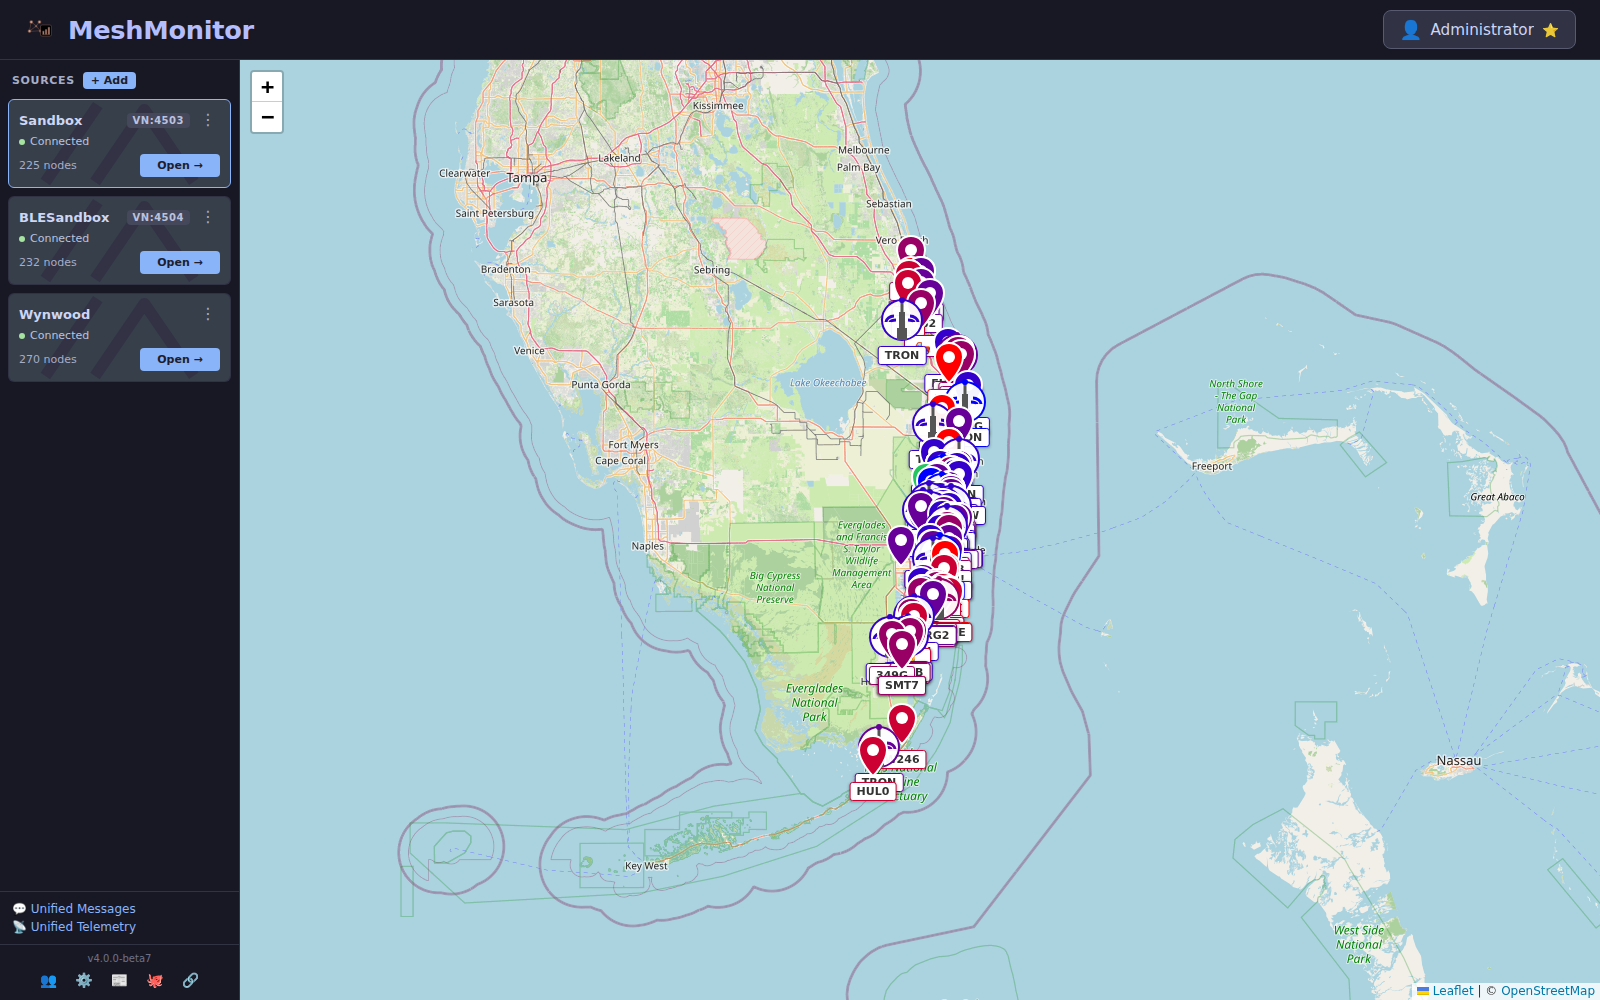
View every connected mesh — Meshtastic, MeshCore, MQTT — on a single interactive map, with nodes colored by signal strength and connectivity status. Track node positions, signal quality, and network topology in real-time.
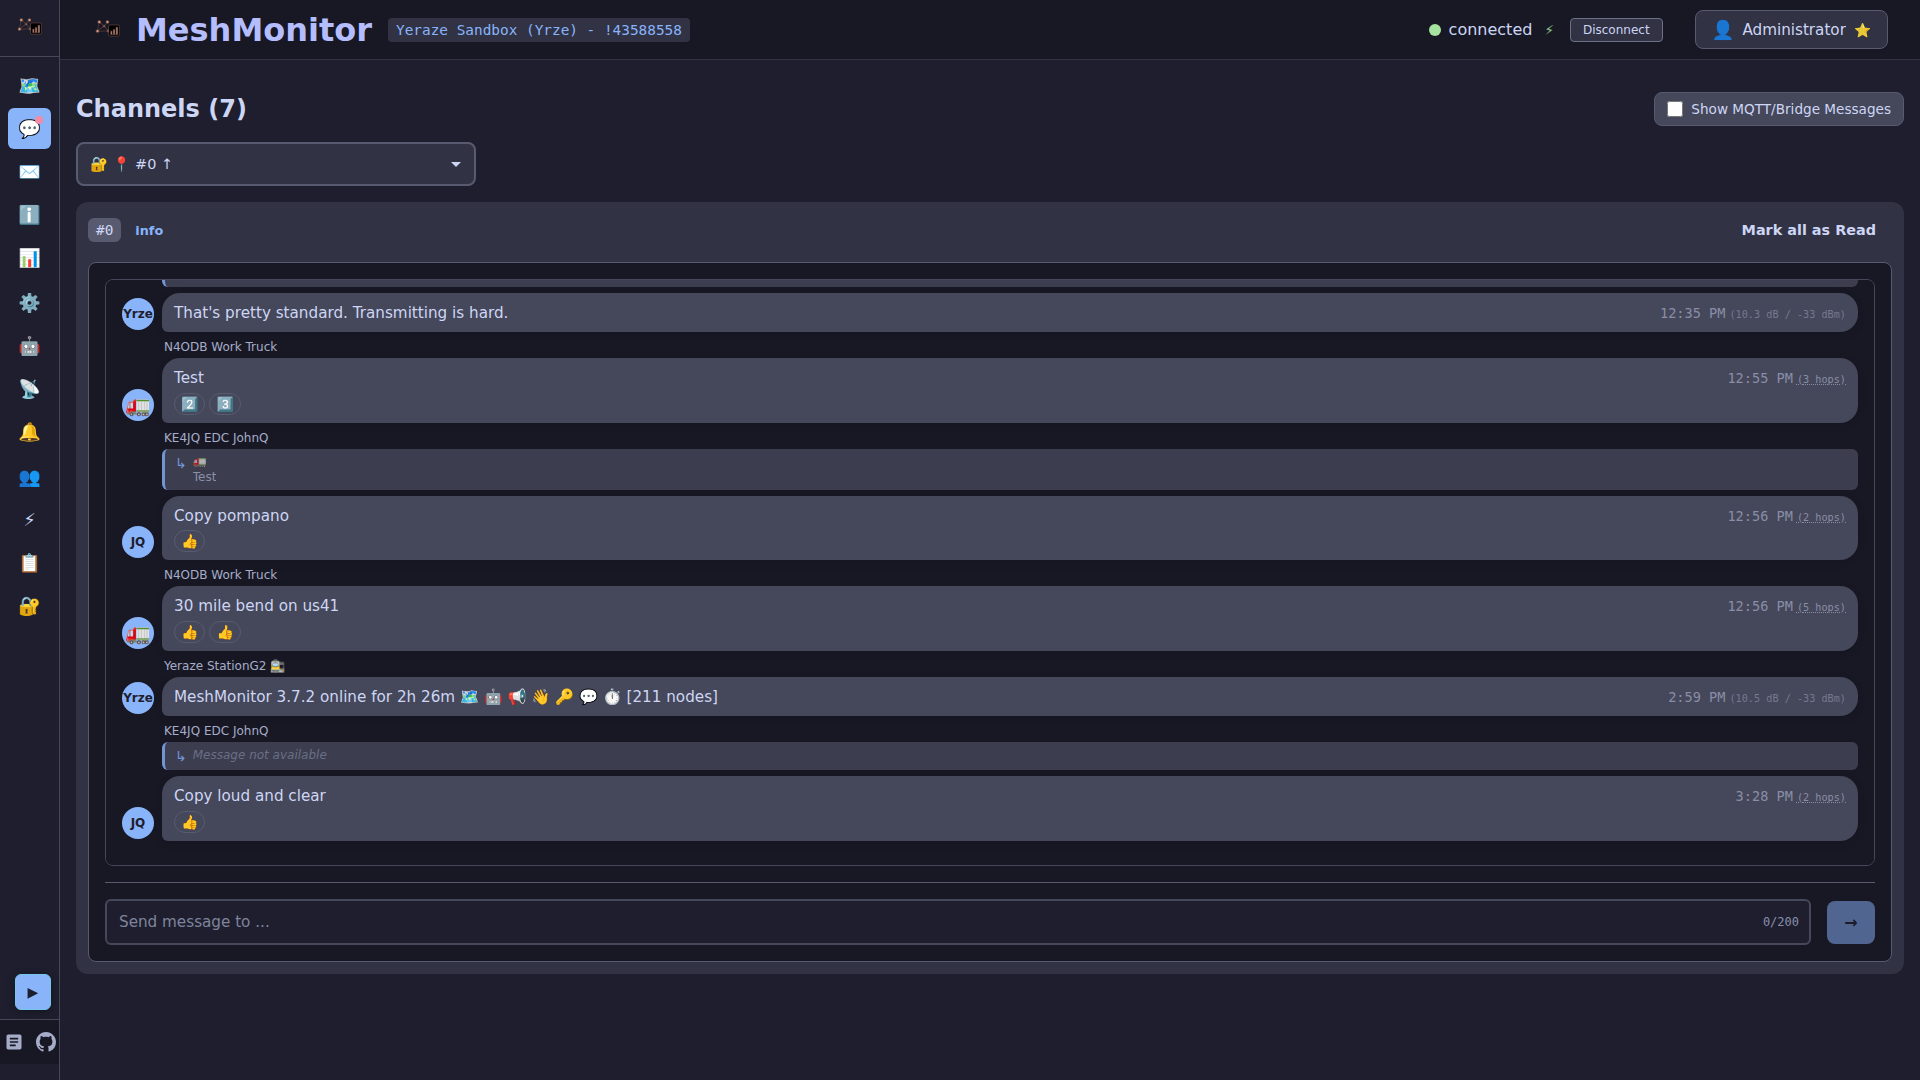
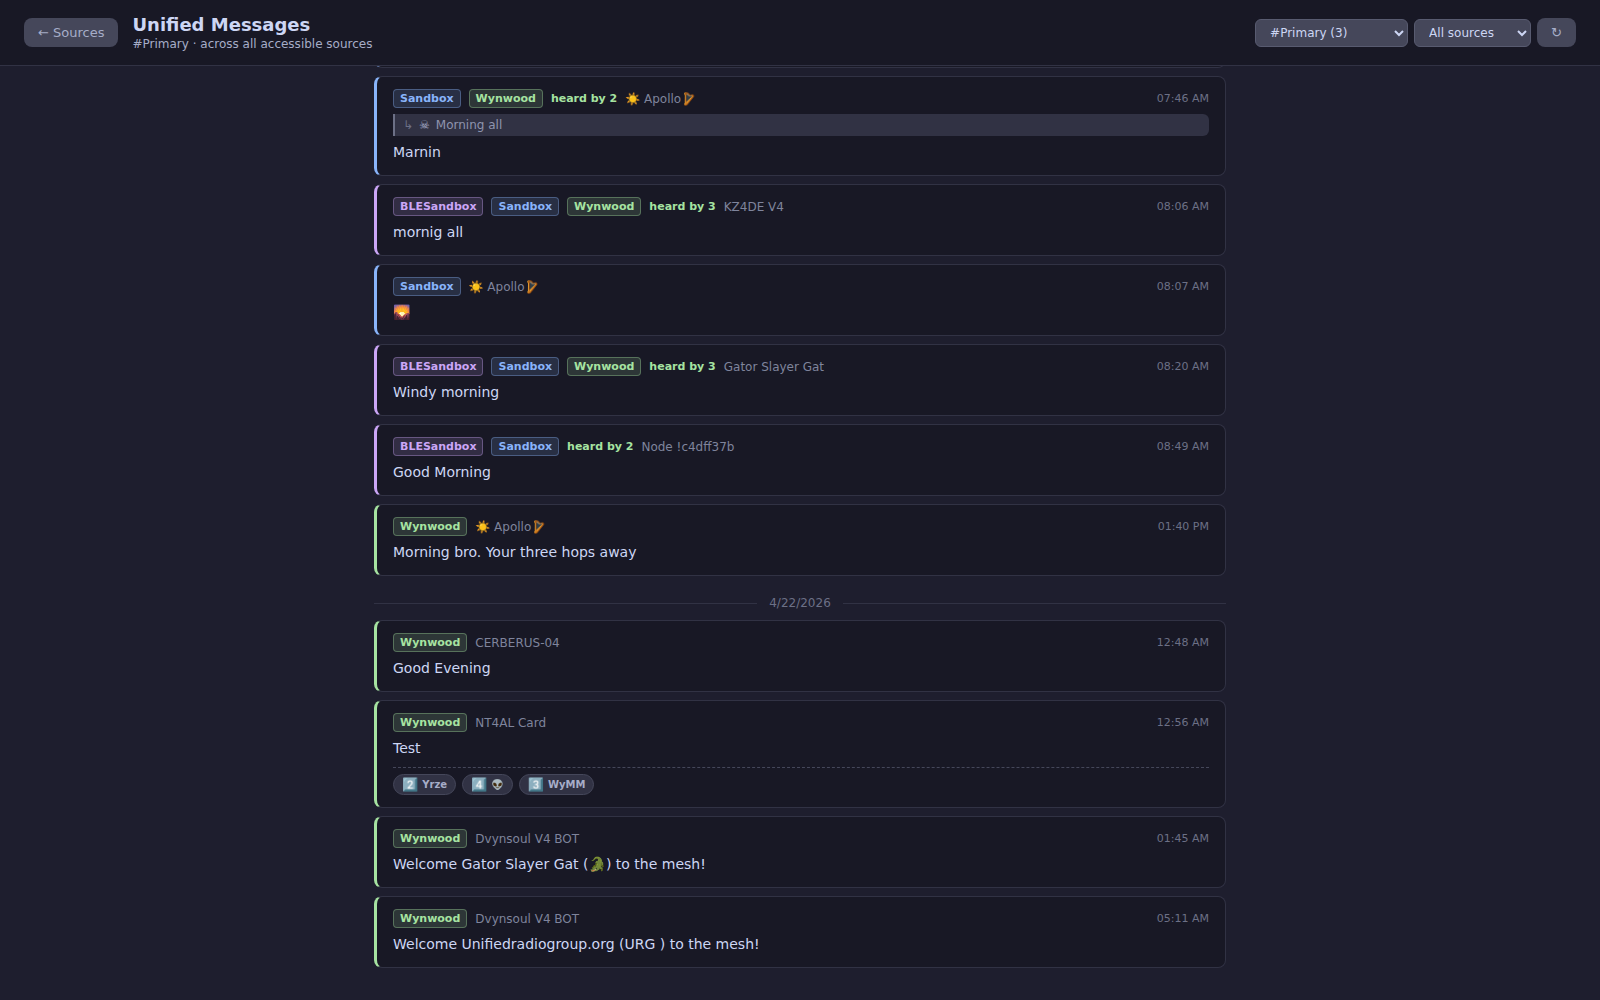
Access complete message history across every source and channel. Search, filter, and export messages for analysis or record-keeping.
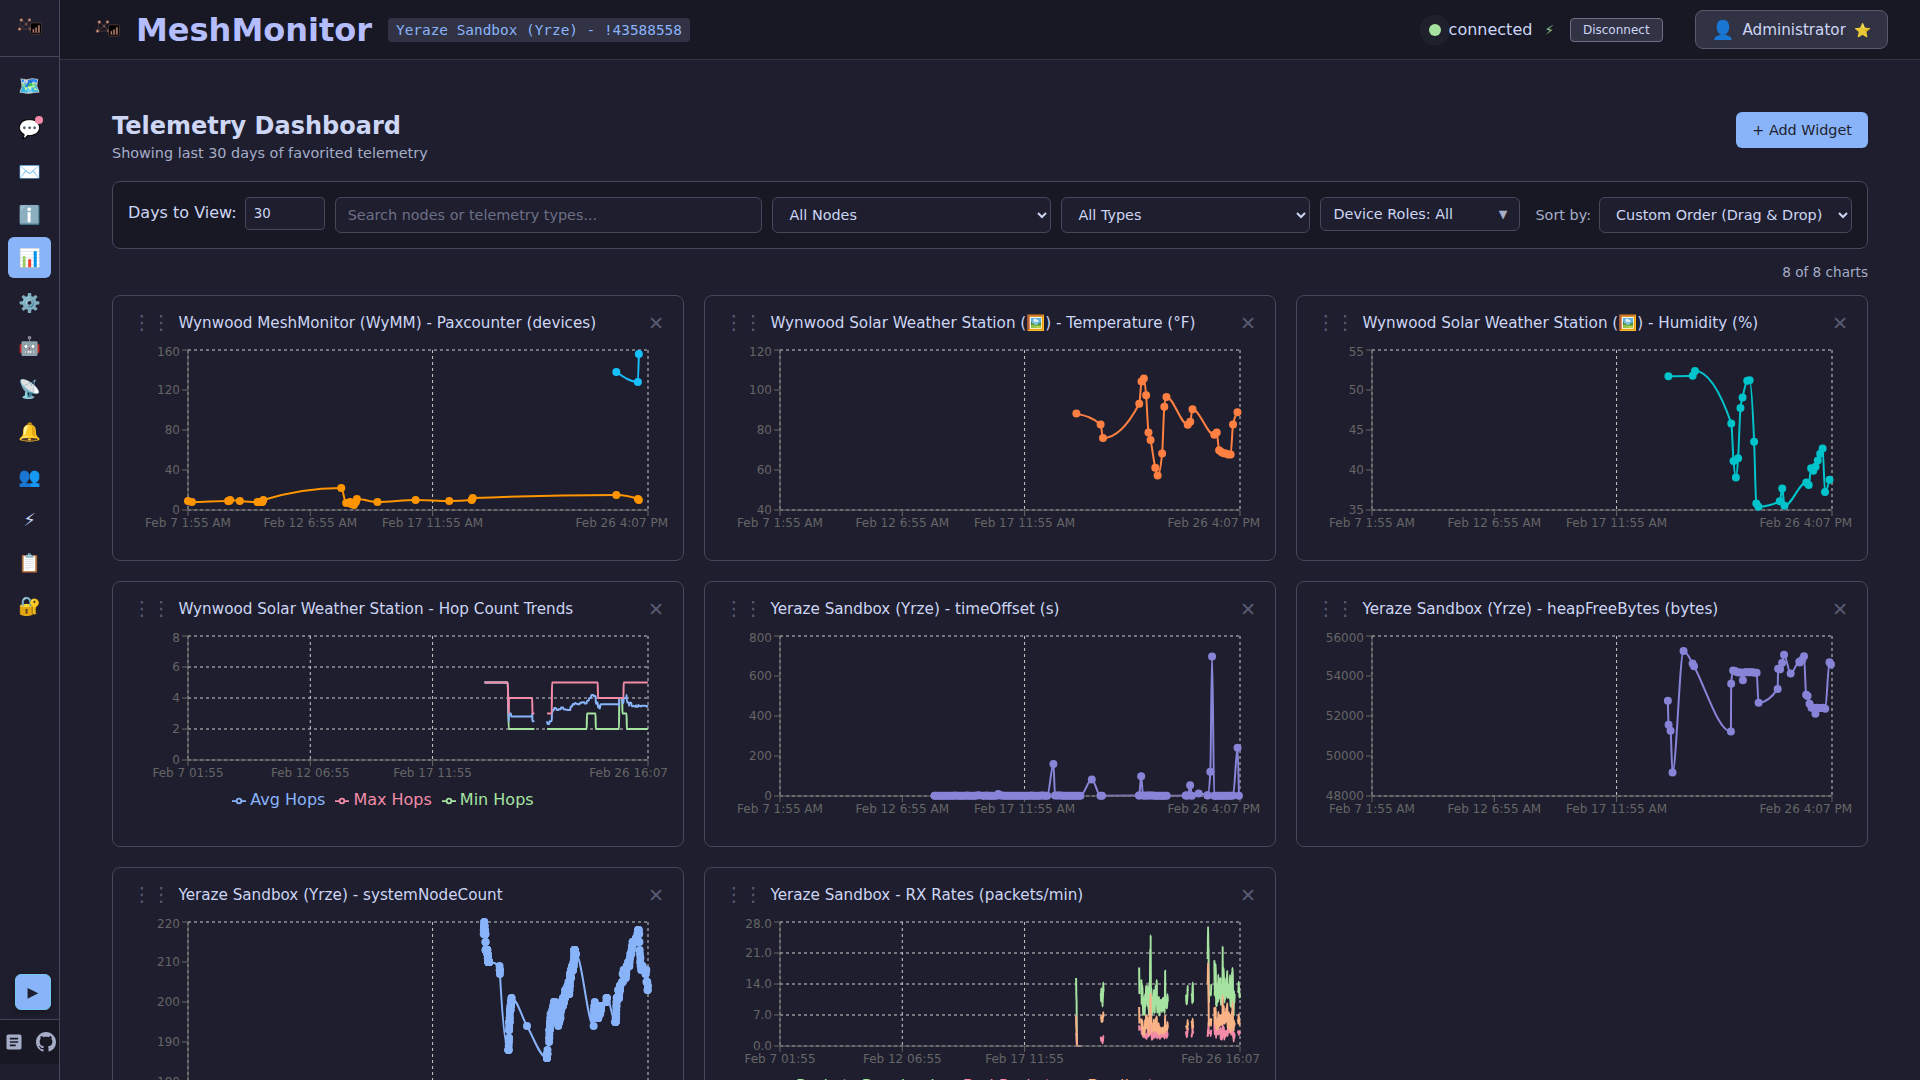
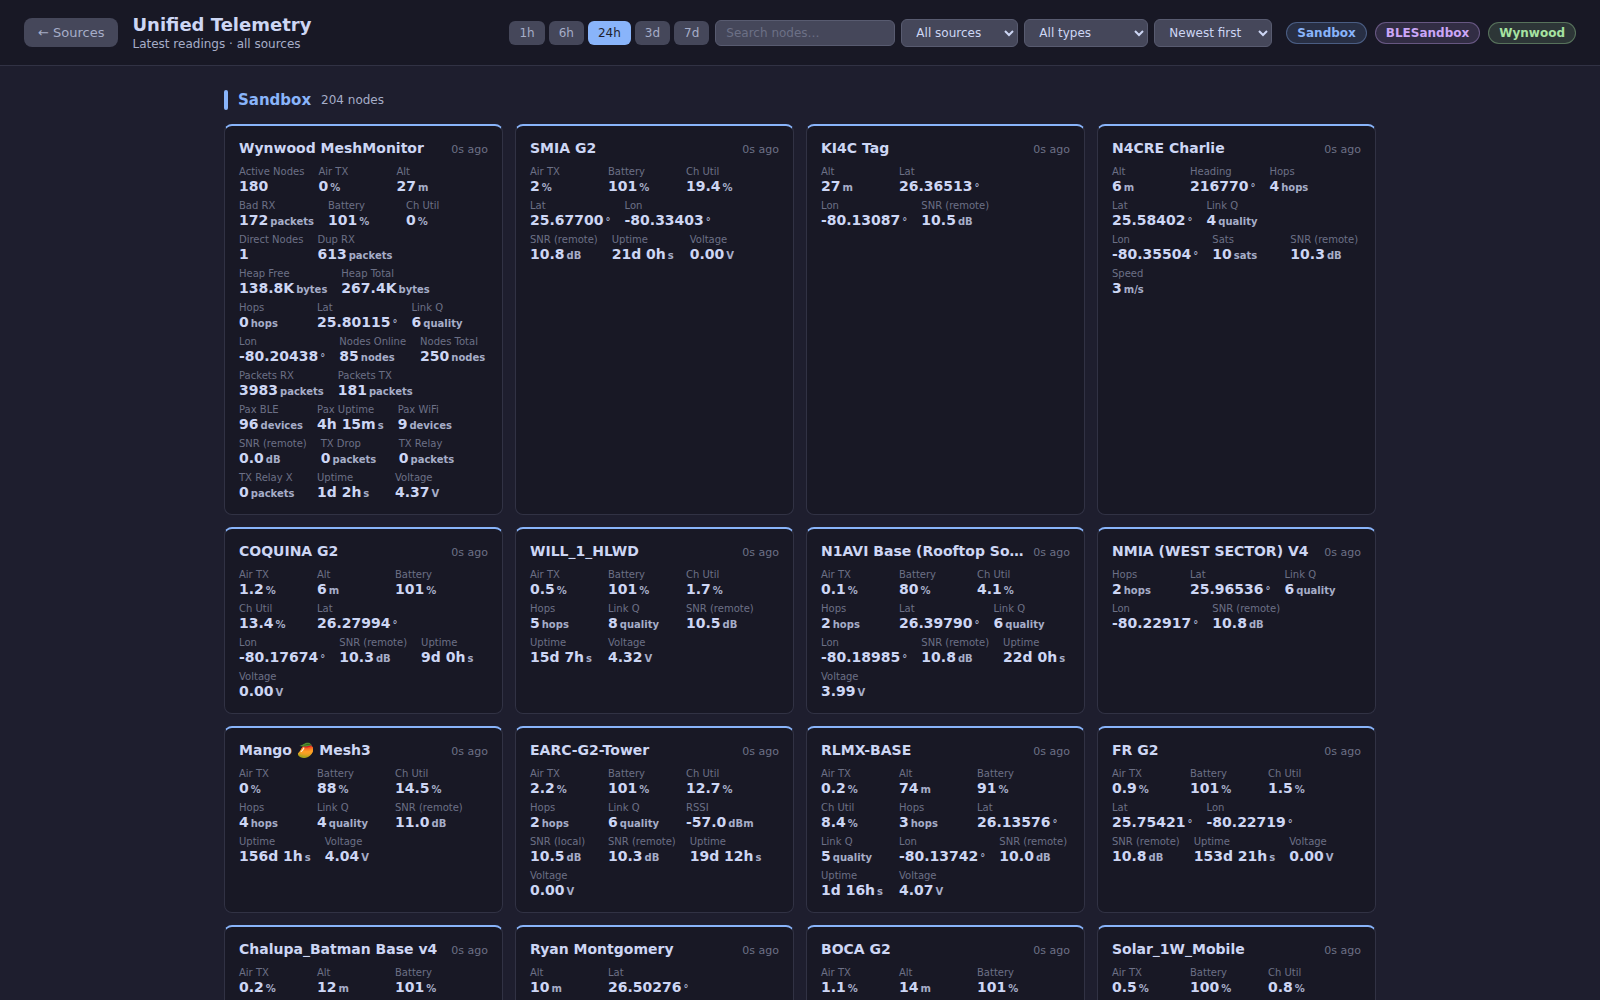
Monitor individual node health, battery levels, environmental telemetry, and connection status. View detailed statistics for each node in your network, regardless of source protocol.
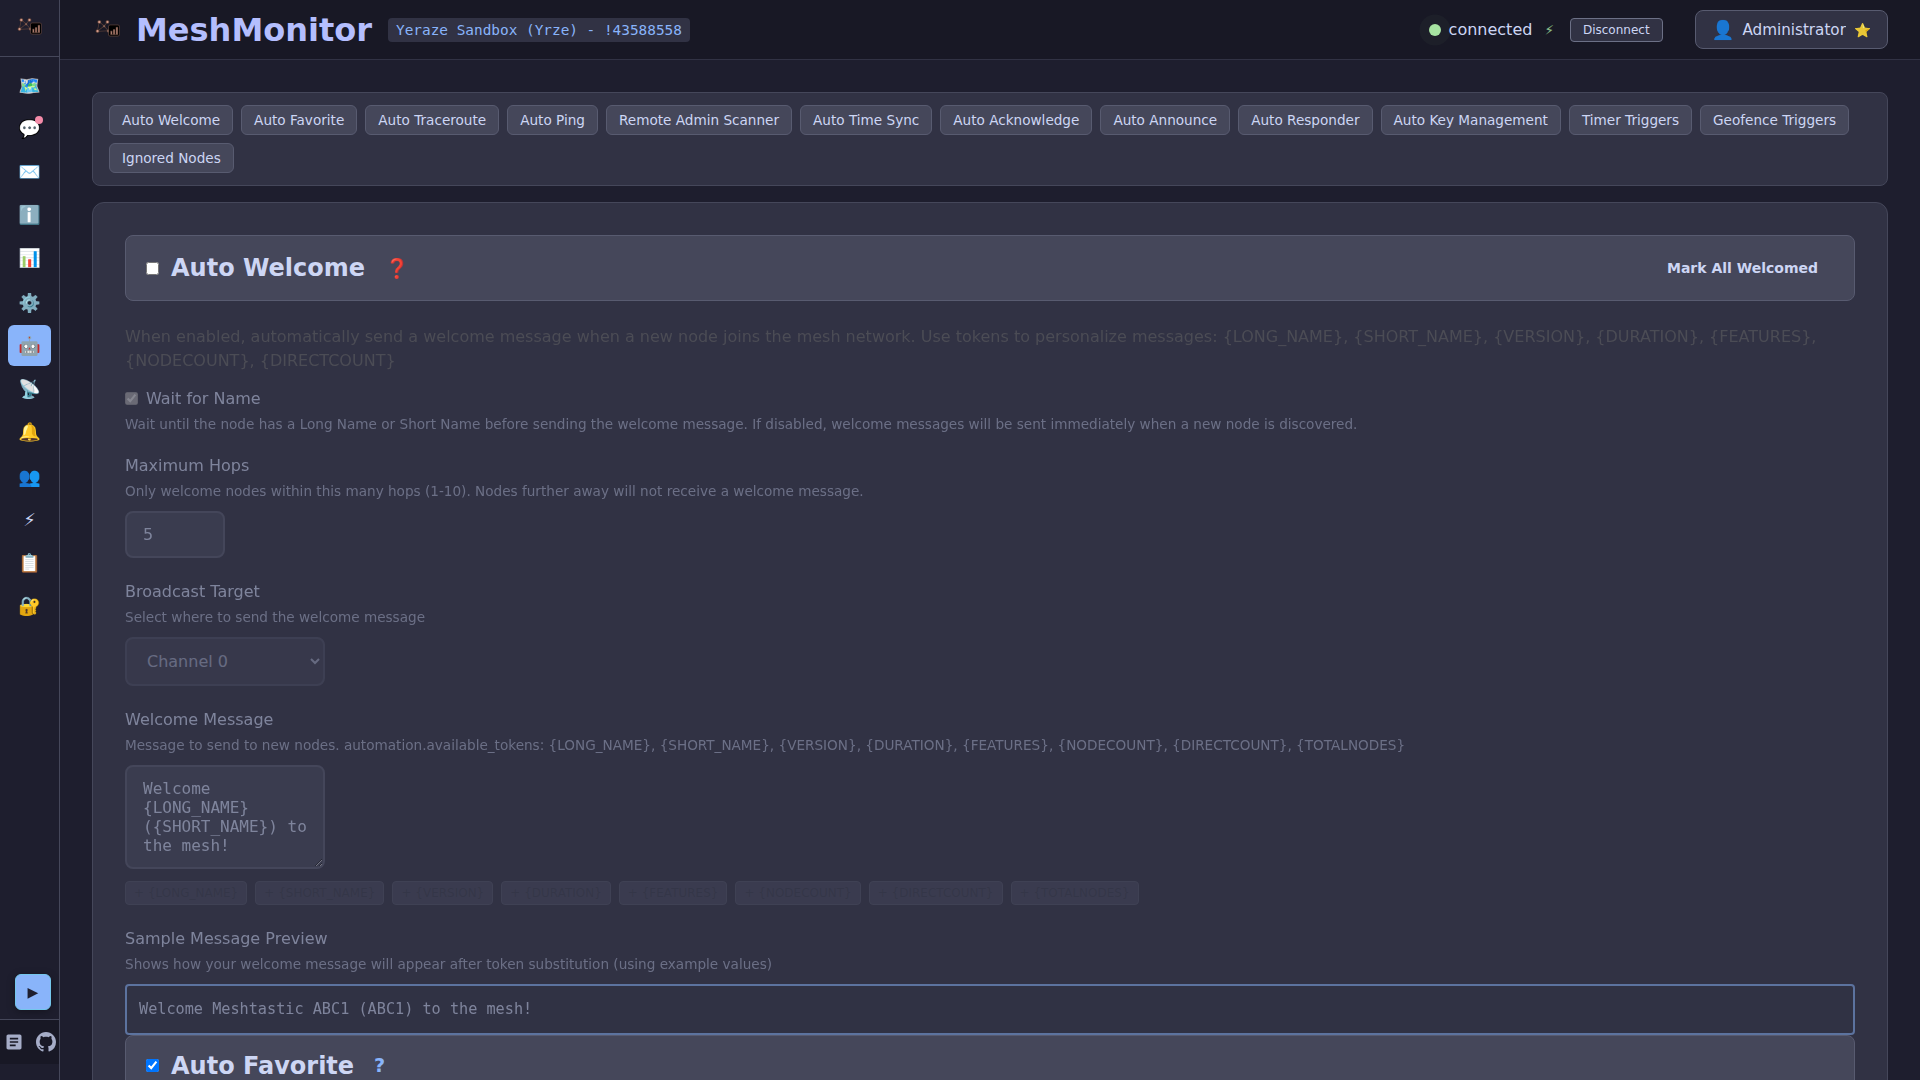
Manage multiple channels, view channel settings, and monitor message flow across different communication channels — Meshtastic channels, MeshCore channels, and MQTT topics alike.
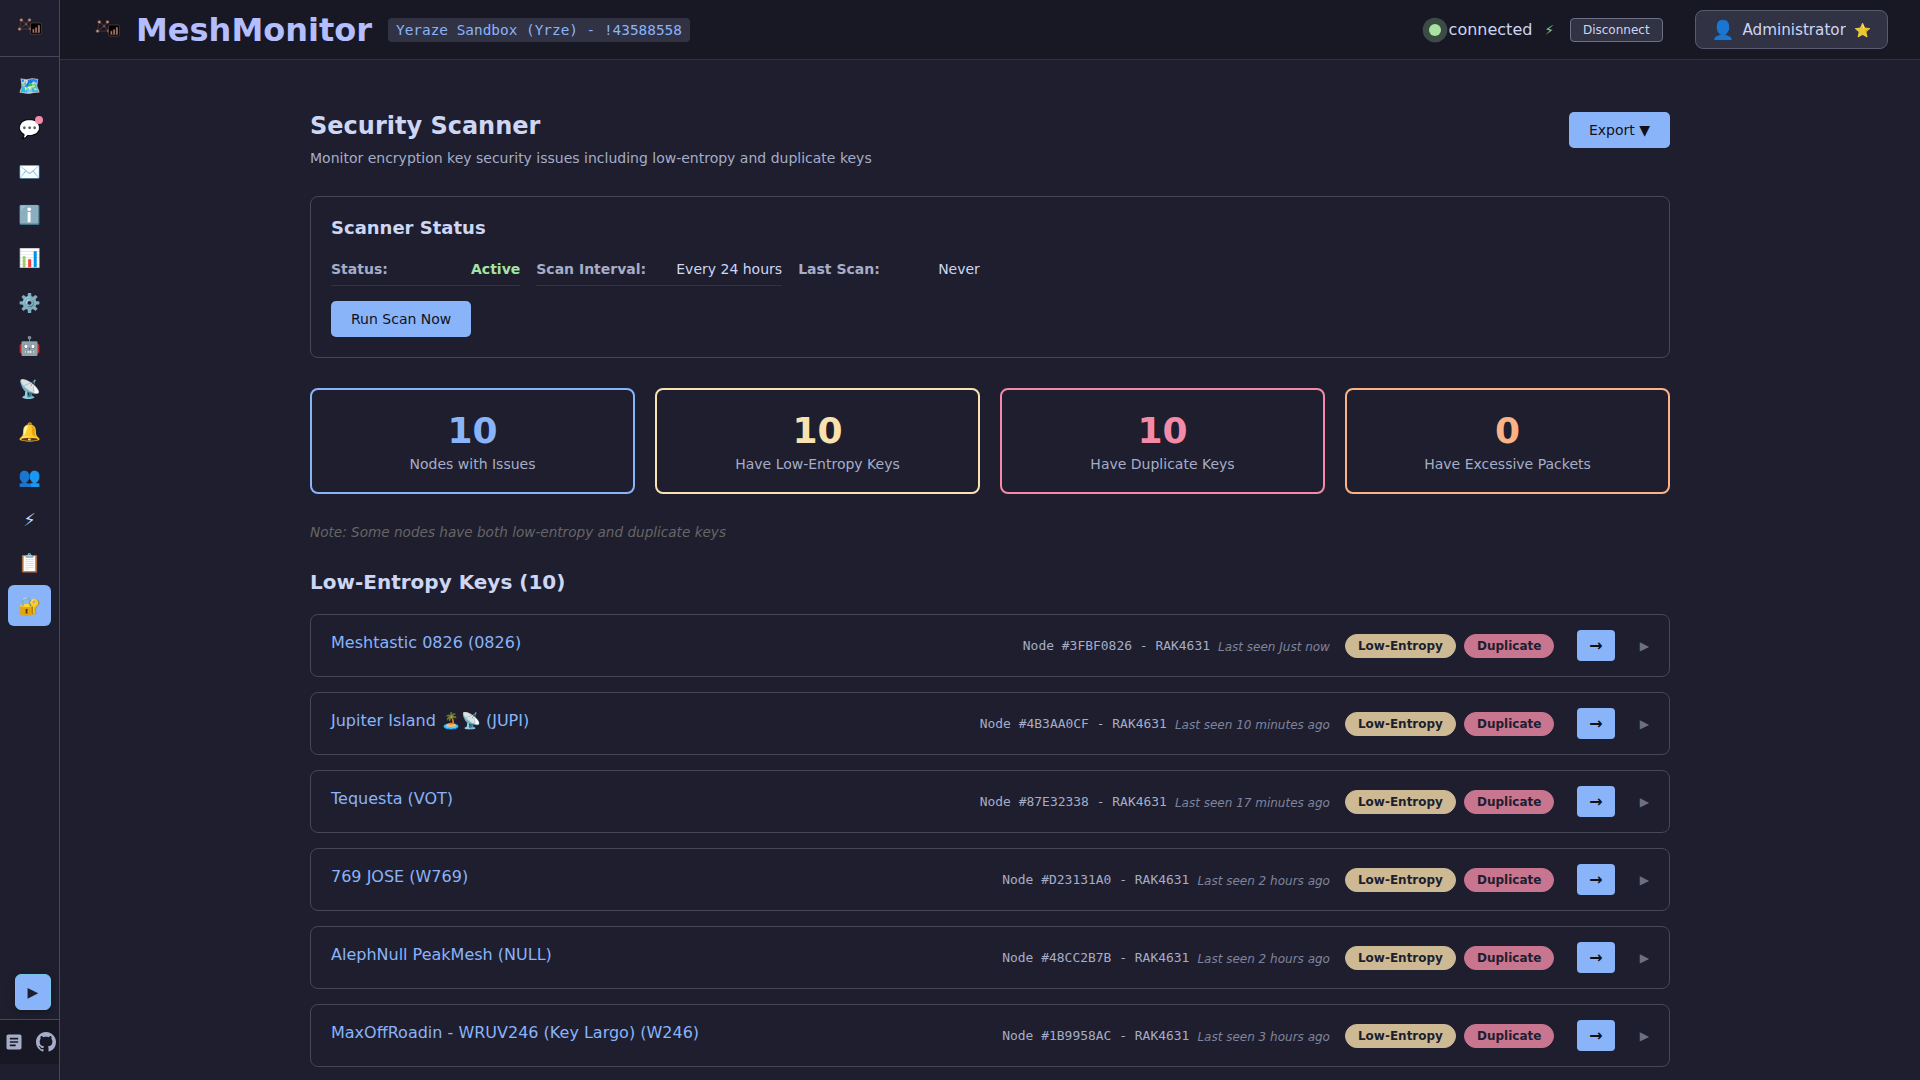
Automatically detect and flag nodes with security vulnerabilities. MeshMonitor identifies low-entropy (weak) encryption keys and duplicate keys shared across multiple Meshtastic nodes. Visual warnings and filtering options help you maintain a secure mesh.
MeshMonitor supports multiple deployment scenarios:
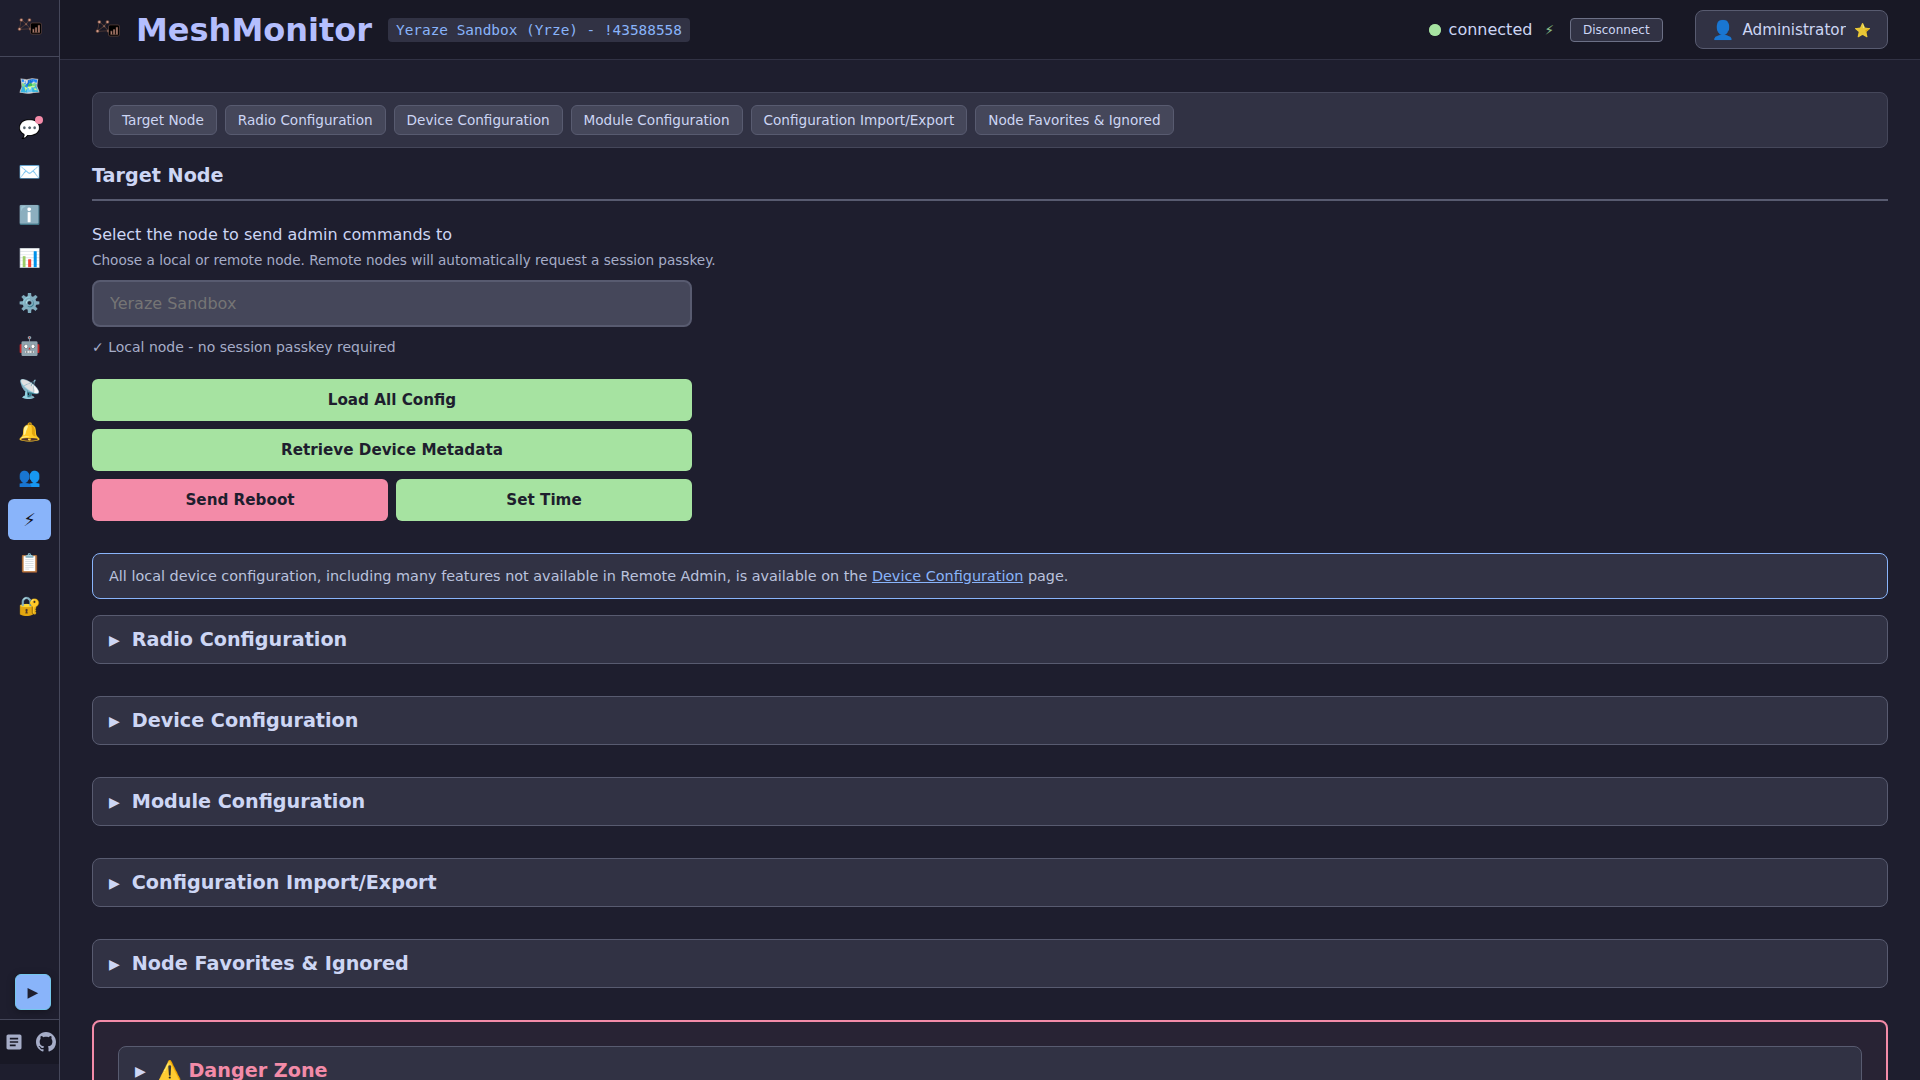
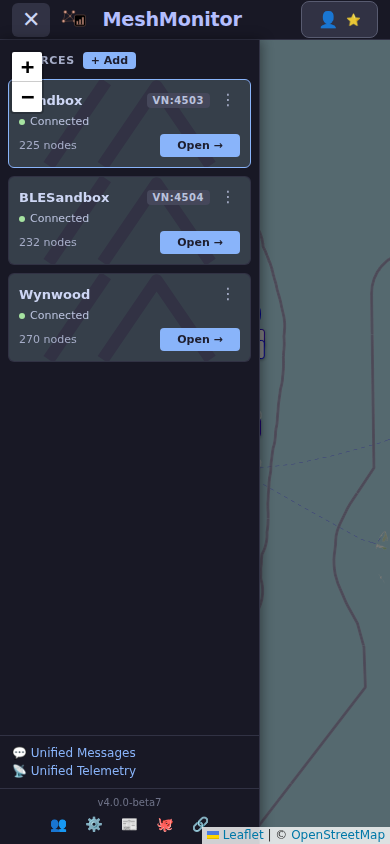
Every source your deployment touches shows up in the sidebar with its own health, map pin colour, and unified or source-scoped views. Meshtastic (TCP, plus Serial/BLE via the bridge sidecars), MeshCore (USB or TCP), MQTT brokers, and the embedded MQTT bridge are all first-class — mix and match without a restart.
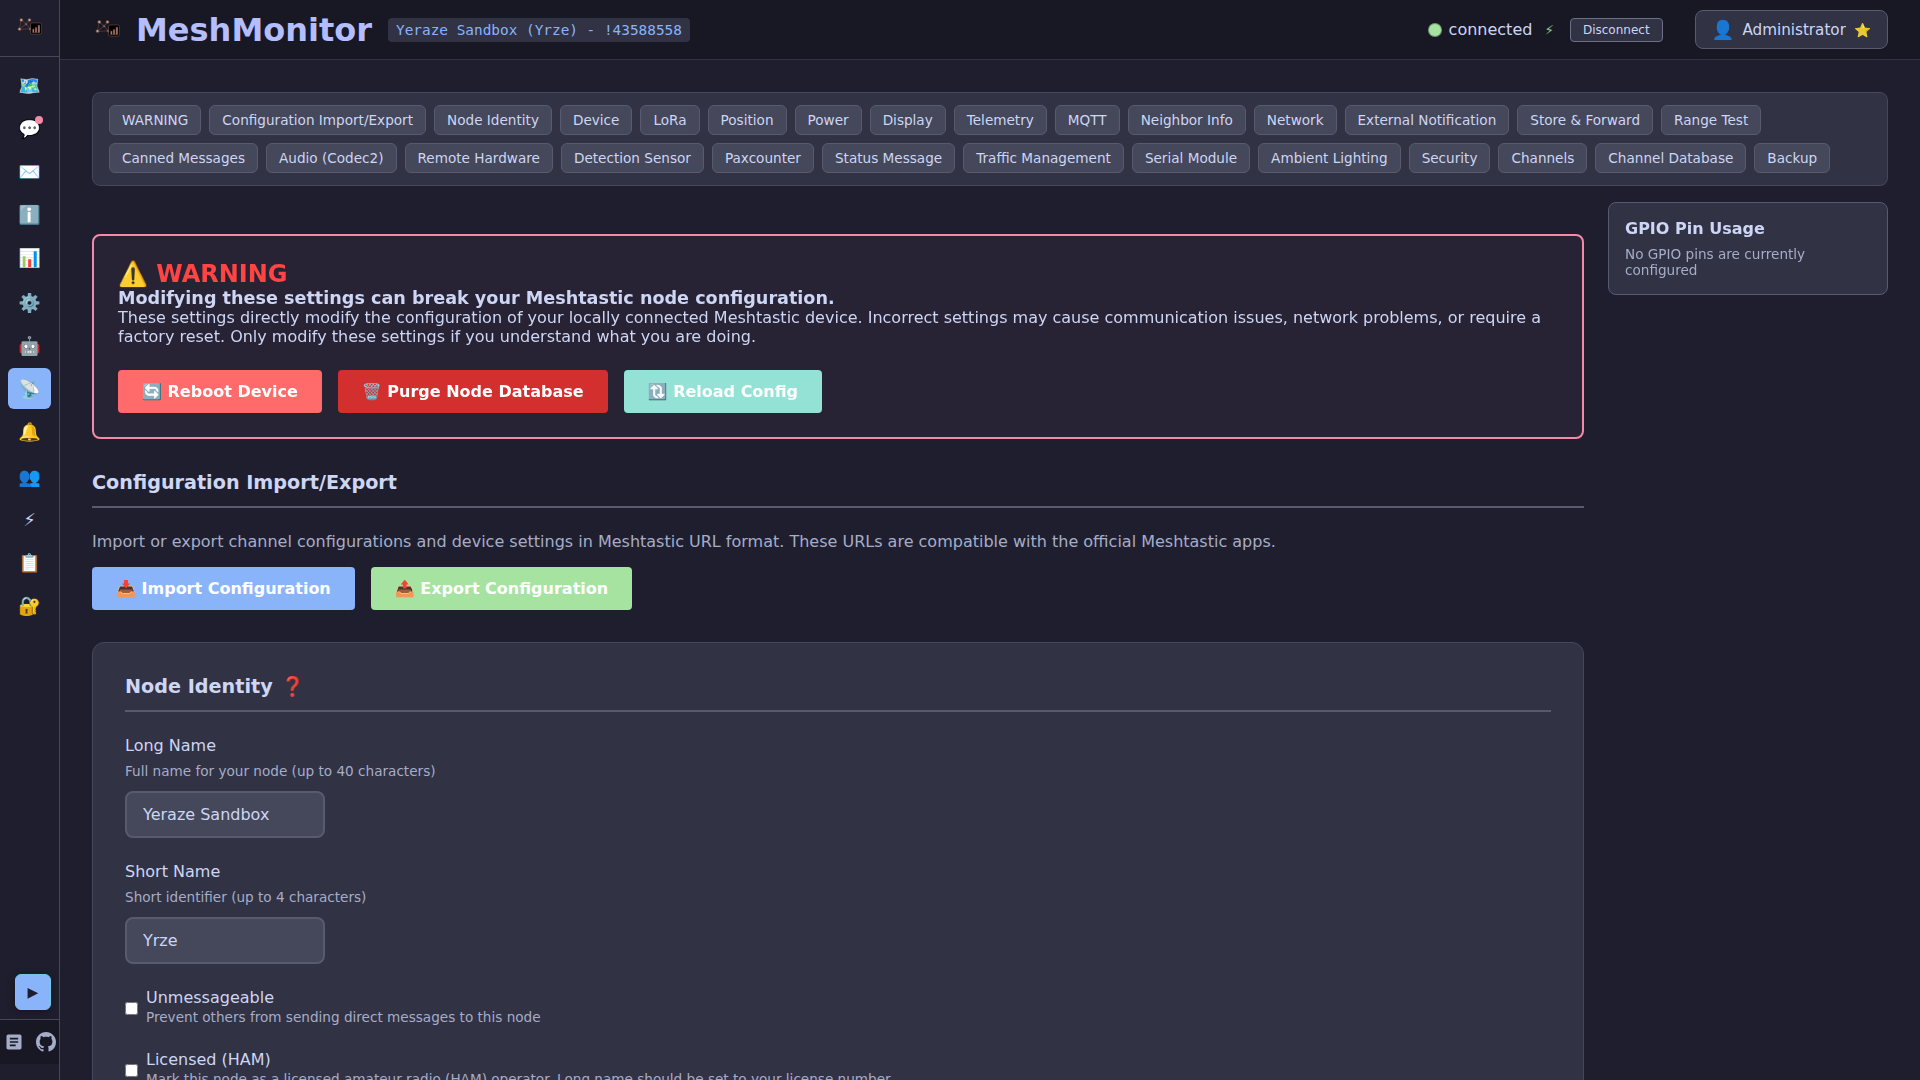
Add, edit, restart, or delete any upstream connection from the dashboard. No env-var edits, no container restarts.
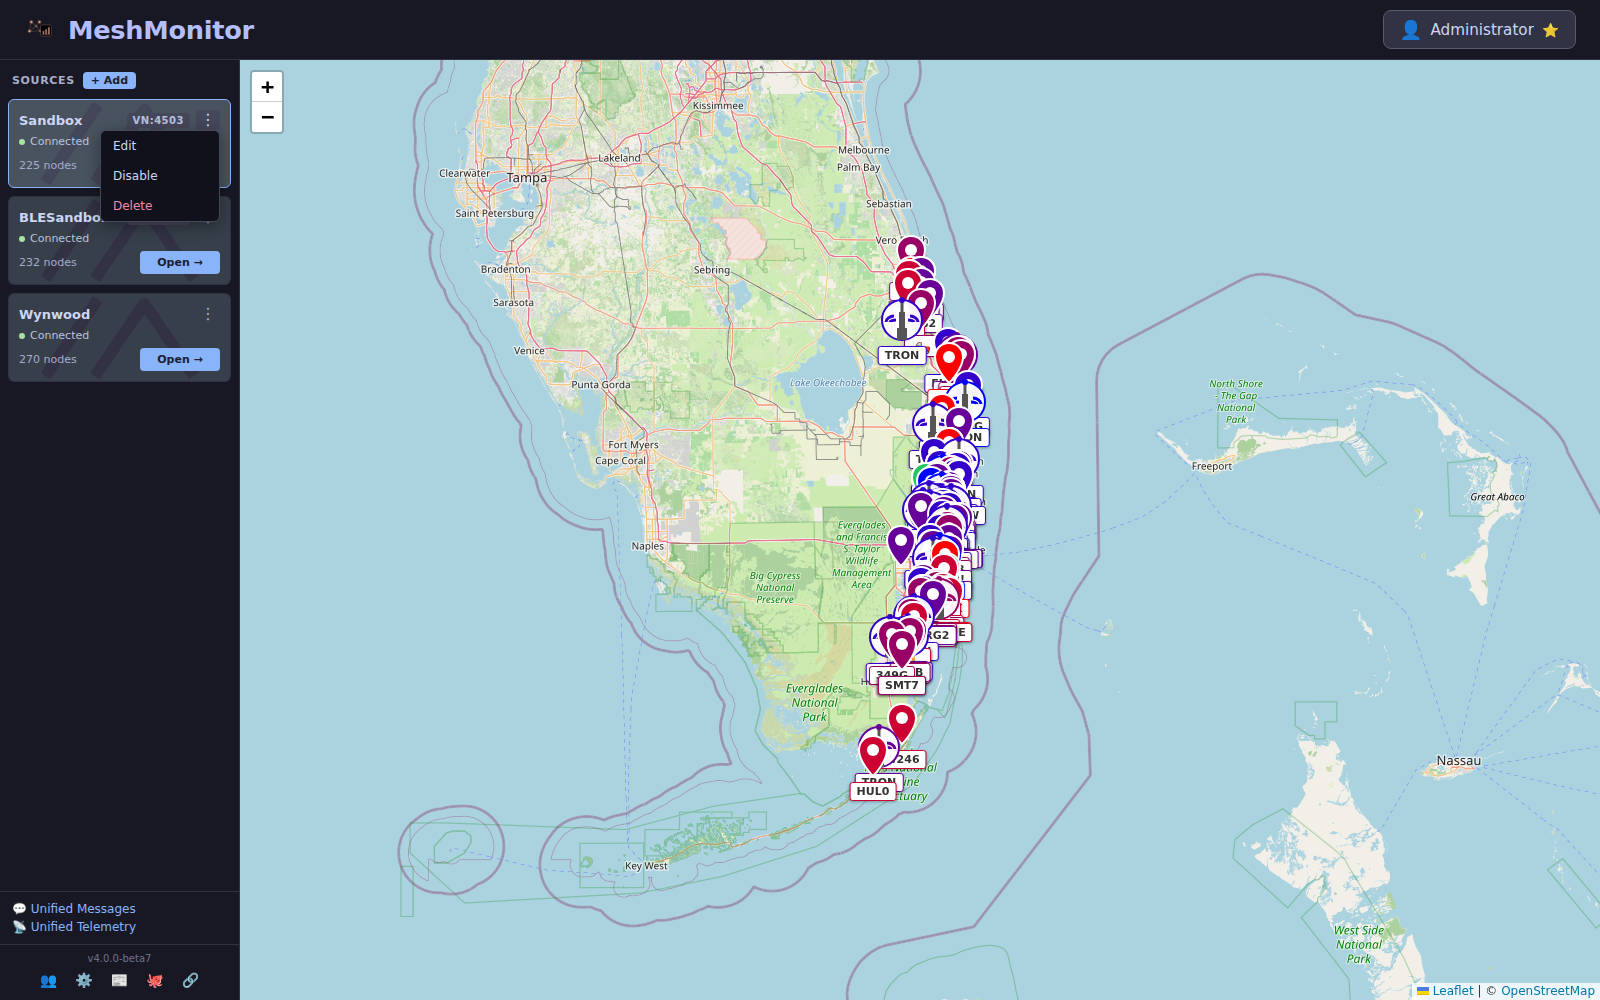
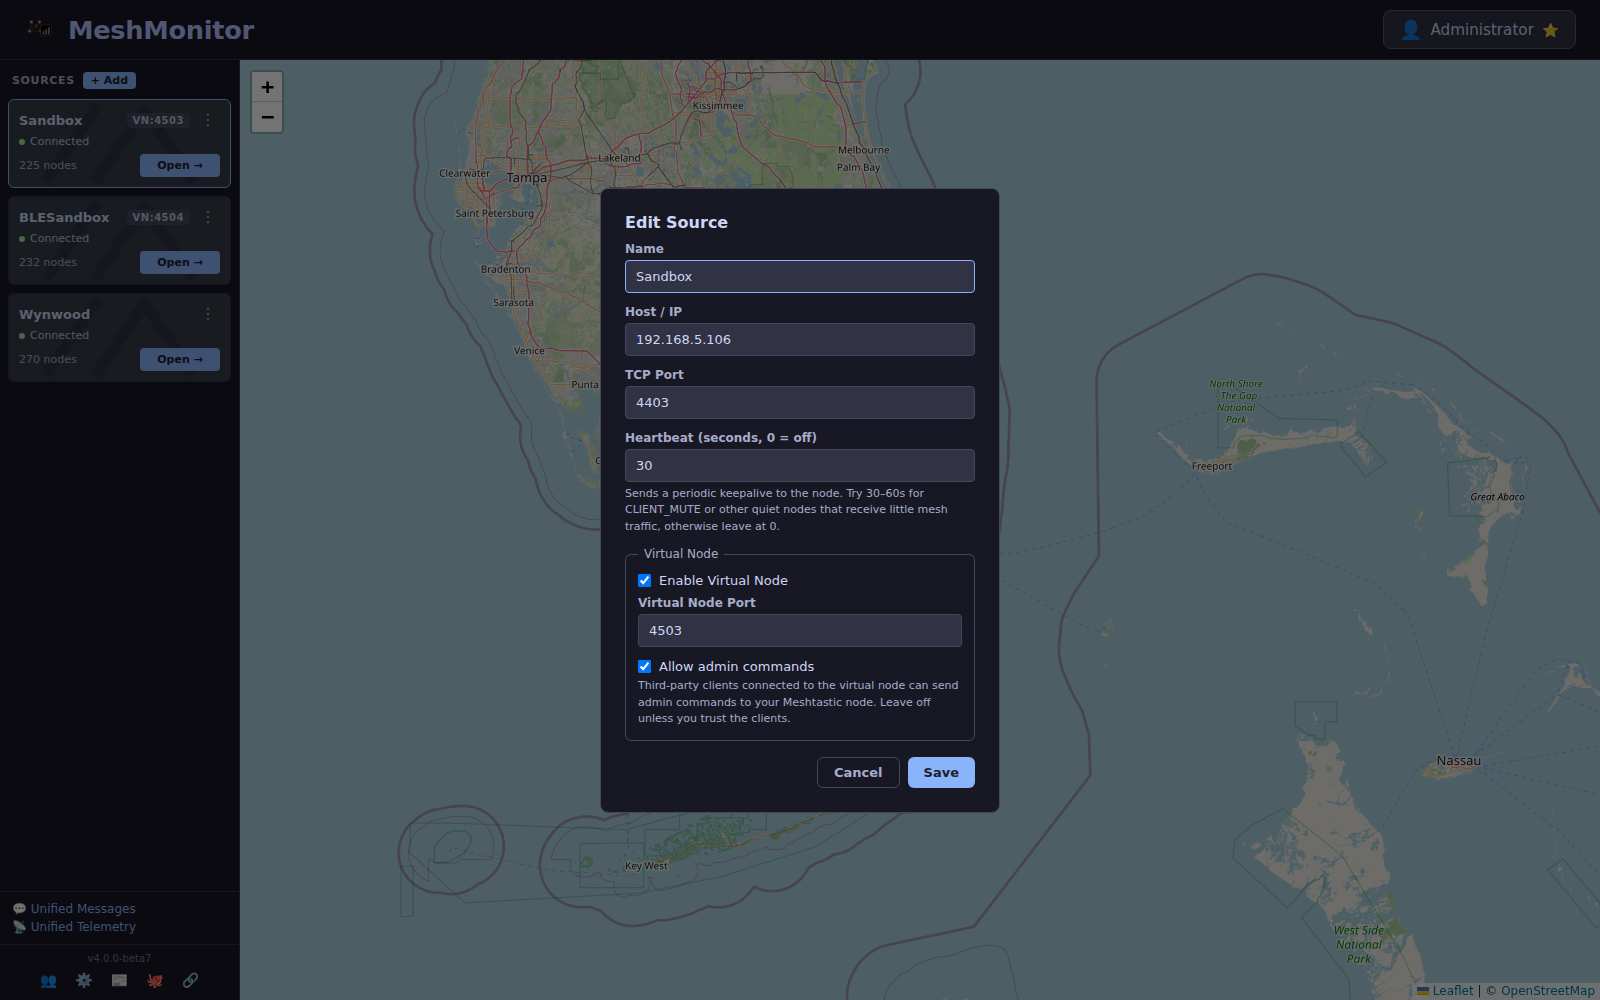
Each TCP source gets its own Virtual Node endpoint, its own auto-responder, its own scheduler — all in one Edit Source dialog.
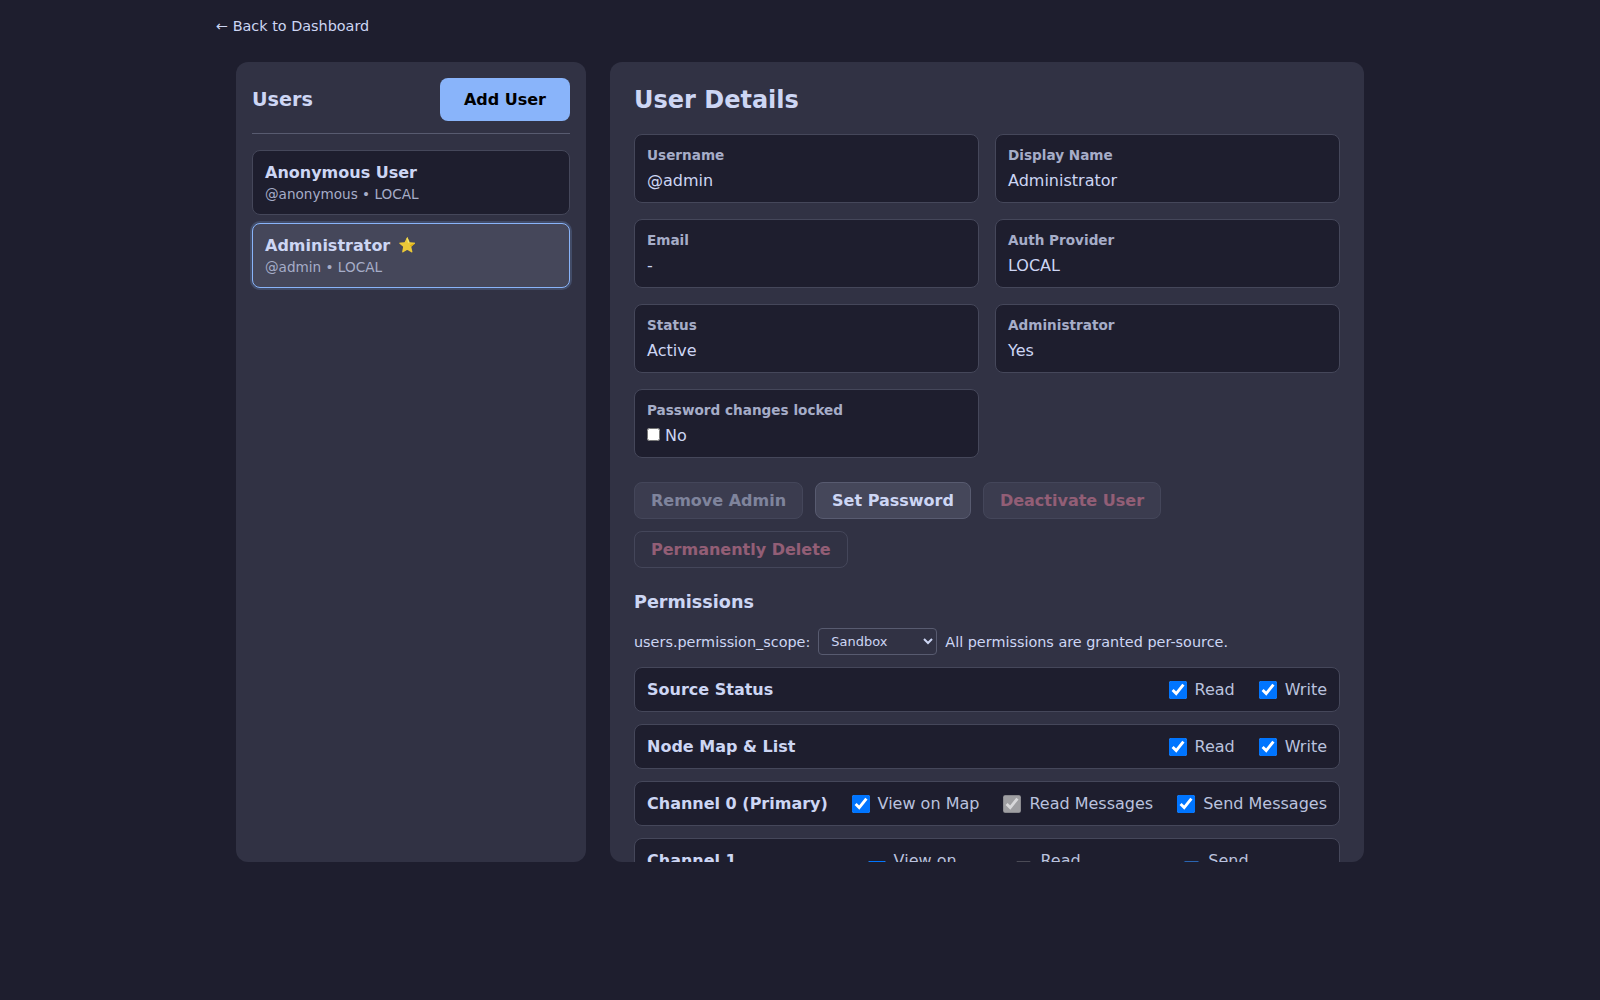
Grant a user admin rights on one source, read-only on another, and hide a third. Per-channel controls sit right alongside the source scope dropdown.
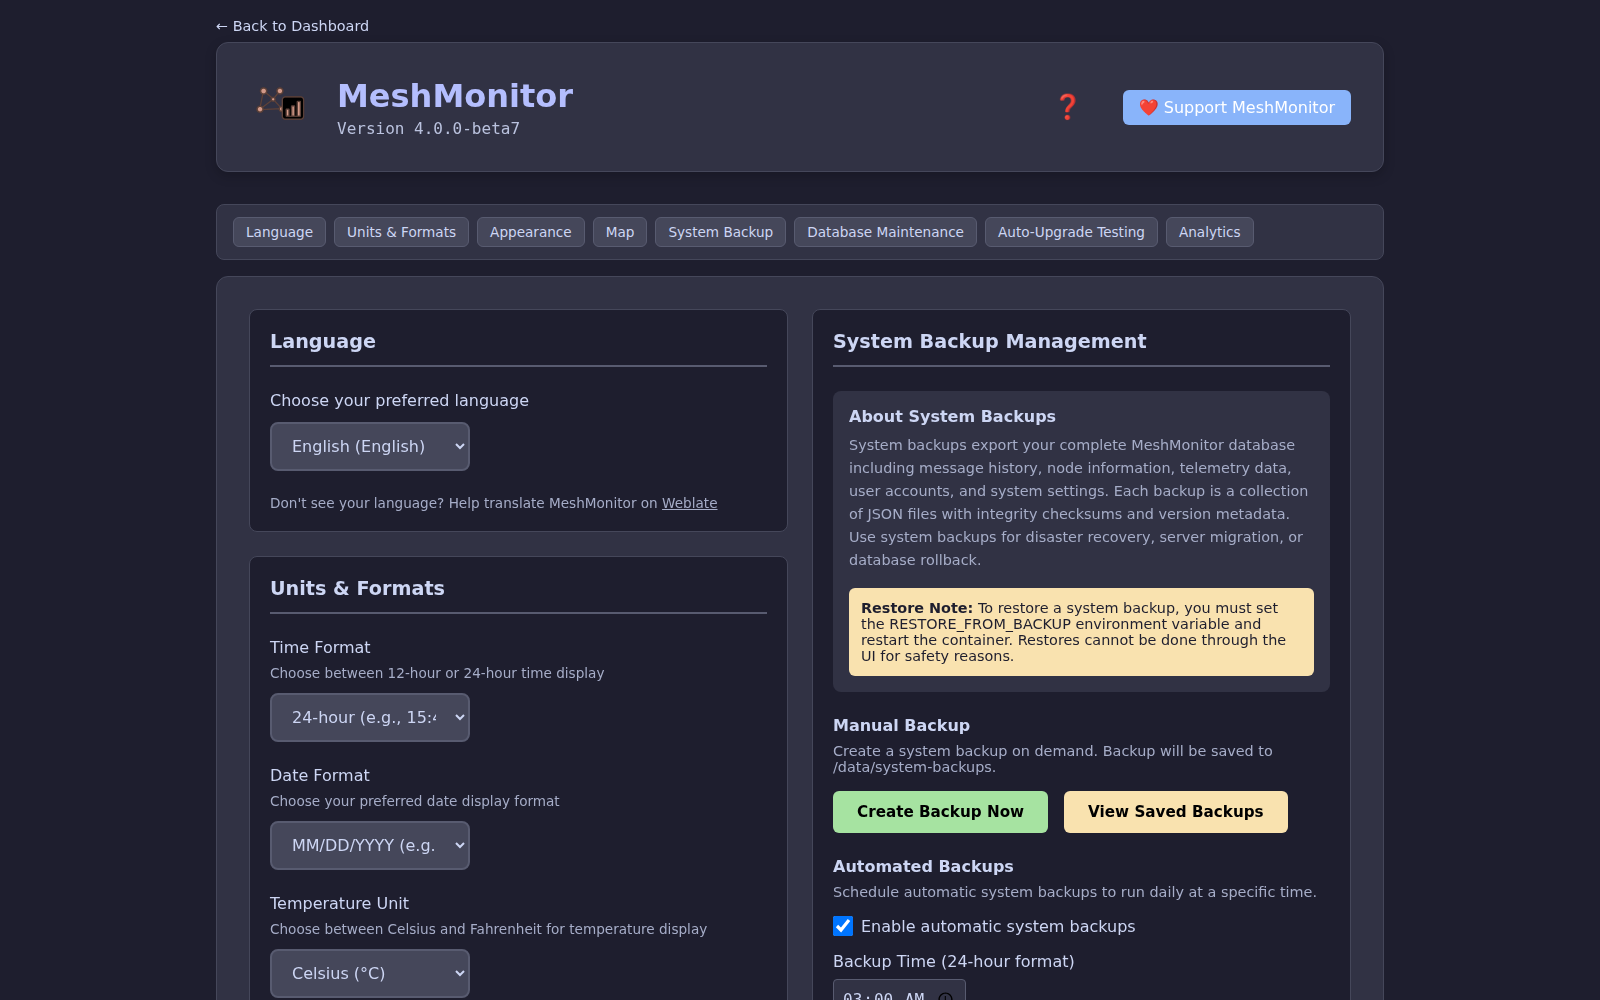
Theme, language, map defaults, push keys, backup schedule — the things that apply to the whole deployment — live on one screen.
Read and search messages across every source from a single view, with an optional per-source filter.
Telemetry charts, gauges, and tables aggregated across every connected source.
Track your entire mesh network at a glance with the interactive map and real-time node positions.

Collapsible sidebar and responsive layout for iOS and Android PWAs.
Ready to get started? Head over to the Getting Started guide!