
Automation Features
MeshMonitor includes several automation features that can help you manage your mesh network more efficiently. These features run in the background and can be configured through the Info tab.
Auto Acknowledge
Automatically responds to messages matching a specific pattern with a customizable confirmation message.
How It Works
When enabled, MeshMonitor monitors all incoming messages for patterns matching the configured regular expression. When a match is found, it automatically replies with your custom message template.
Configuration
Enable/Disable: Toggle the checkbox next to "Auto Acknowledge"
Message Pattern (Regular Expression): Defines which messages trigger auto-acknowledgment
- Default:
^(test|ping) - Case Insensitive: Patterns match regardless of capitalization
- Maximum Length: 100 characters
- Examples:
^ping- Matches messages starting with "ping"test- Matches messages containing "test" anywhere^(hello|hi|hey)- Matches messages starting with hello, hi, or hey
Pattern Testing: The interface includes a live testing area where you can enter sample messages to see if they match your pattern. Matching messages are highlighted in green, non-matching in red.
Custom Message Template: Craft your auto-acknowledge response using dynamic tokens:
{HOPS}or{NUMBER_HOPS}: Number of hops from the original message (e.g., "3" for multi-hop or "0" for direct){RABBIT_HOPS}: Visual hop indicator (🎯 for direct/0 hops, 🐇 emojis for multi-hop, e.g., "🐇🐇🐇" for 3 hops){DATE}: Date when the message was received (e.g., "1/15/2025"){TIME}: Time when the message was received (e.g., "2:30:00 PM"){LONG_NAME}: Long name of the sender (e.g., "Alice's Node"){SHORT_NAME}: Short name of the sender (e.g., "ALI"){NODE_ID}: Sender's node ID (e.g., "!a1b2c3d4"){SNR}: Signal-to-Noise Ratio in dB (e.g., "7.5"){RSSI}: Received Signal Strength Indicator in dBm (e.g., "-95"){LAST_HOP}: Short name of the last relay node (e.g., "RLY1"); falls back to the hex byte (e.g., "0x4F") when the relay isn't in the node database, or "unknown" when there's no relay info{VERSION}: MeshMonitor version{DURATION}: System uptime{FEATURES}: Enabled automation features{NODECOUNT}: Number of active nodes{DIRECTCOUNT}: Number of direct nodes (0 hops)
Default Template (Multi-hop):
🤖 Copy, {NUMBER_HOPS} hops at {TIME}Default Template (Direct Connection):
🤖 Copy, direct connection! SNR: {SNR}dB RSSI: {RSSI}dBm at {TIME}Separate Templates for Direct vs. Multi-hop: You can configure different acknowledgment messages for direct connections (0 hops) versus multi-hop messages. This allows you to include signal quality metrics like SNR and RSSI for direct connections while showing hop count for relayed messages.
Example Custom Templates:
✅ Received from {LONG_NAME} on {DATE} at {TIME}📡 Signal test: {HOPS} hop(s) | Date: {DATE} | Time: {TIME}👋 Hey {LONG_NAME}! Got your message: "{MESSAGE}"Token Insertion: Click on any token button to insert it at your cursor position, making it easy to build complex templates.
Sample Message Preview: The interface shows a live preview of what your auto-ack response will look like with example token values filled in. Separate previews are shown for direct and multi-hop messages, so you can see exactly how each template will render before saving.
Channel Selection
Control which channels and message types trigger auto-acknowledgment:
Direct Messages: A separate toggle enables or disables auto-ack responses for direct messages (DMs). When disabled, DMs are ignored even if they match the pattern.
Channels 0–7: Individual checkboxes for each channel allow you to enable or disable auto-ack on a per-channel basis. Only messages received on enabled channels will trigger a response.
This granular control lets you respond on your primary channel while ignoring traffic on other channels, or vice versa.
Response Modes
Auto Acknowledge supports two independent response modes, each with separate toggles for direct and multi-hop messages:
Tapback (Emoji Reaction): React to the triggering message with an emoji instead of (or in addition to) a text reply:
- Direct messages receive a 🎯 reaction
- Multi-hop messages receive a keycap digit emoji indicating the hop count (0️⃣ through 7️⃣)
Text Reply: Send the configured message template as a text response. This is the traditional auto-ack behavior.
Both modes can be enabled simultaneously — for example, you can send a tapback reaction and a text reply to every matched message. Each mode has independent toggles for direct and multi-hop, giving you full control over which connection types get which response.
Always Use Direct Message
When enabled, auto-ack responses are sent as direct messages (DMs) to the sender, even when the triggering message was received on a channel.
Use case: Avoid cluttering shared channels with automated responses. For example, if someone sends "ping" on a busy group channel, the auto-ack reply goes only to them instead of the entire channel.
Pre-Send Delay
Description: An optional pause (in seconds) before the auto-acknowledge response is sent, applied on both Meshtastic and MeshCore sources.
Default: 0 (immediate) — Maximum: 120 seconds
When to use it: Give a repeater time to finish transmitting the triggering message before your reply goes out, instead of racing it. For anything more elaborate than a single fixed delay — e.g. a delay followed by other actions — use the Automation Engine's Pause action instead.
Skip Incomplete Nodes
Description: When enabled, Auto Acknowledge will not respond to messages from incomplete nodes.
Default: Disabled
What are incomplete nodes?: Nodes missing proper longName, shortName, or hwModel. On secure channels (custom PSK), this typically means we haven't received their encrypted NODEINFO packet - they may have just overheard traffic but aren't verified channel members.
When to enable:
- Using secure/encrypted channels with custom PSK
- Want to only acknowledge messages from verified nodes
- Prevent responding to nodes that may be eavesdropping
Related: See Hide Incomplete Nodes for UI filtering.
Side Effects
- Generates additional mesh traffic for each matched message
- May contribute to network congestion if pattern matches too frequently
- Replies are sent immediately upon receiving a matching message
- Uses airtime on the mesh network for responses
Use Cases
- Testing mesh range and reliability
- Monitoring network responsiveness
- Automated acknowledgment of status checks
- Quick ping/pong style network testing
Related Meshtastic Documentation
This feature leverages Meshtastic's messaging capabilities. For more information about Meshtastic messaging, see:
Auto Traceroute
Automatically sends traceroute requests to all active nodes at a configured interval to maintain up-to-date network topology information.
How It Works
When enabled, MeshMonitor periodically sends traceroute requests to all nodes in the active node list. Traceroutes reveal the path messages take through the mesh network, showing which nodes relay traffic between the source and destination.
Configuration
Enable/Disable: Toggle the checkbox next to "Auto Traceroute"
Traceroute Interval: How often to send traceroute requests to nodes
- Range: 1-60 minutes
- Default: 3 minutes
- Recommendation: Use longer intervals (10-15 minutes) for larger networks or slower mesh presets
Node Filter (New in v2.12): Limit traceroutes to specific nodes instead of all nodes
- Enable Filter: Toggle to restrict traceroutes to selected nodes only
- Node Selection: Choose specific nodes from your network to trace
- Search: Filter available nodes by name or ID for easy selection
- Benefits:
- Reduces network congestion in large networks
- Focus on critical or problem nodes
- Save battery on mobile nodes by excluding them
- Customize monitoring for specific network segments
- Recommendation: Enable filtering in networks with 20+ nodes to reduce overhead
Side Effects
- Network Congestion: Each traceroute request generates multiple packets. In large networks with many nodes, this can significantly increase mesh traffic
- Airtime Usage: Consumes airtime on the LoRa radio, which may affect message delivery performance
- Battery Impact: Causes nodes to relay more packets, increasing power consumption
- Requires Restart: Changes to this setting require a container restart to take effect
Use Cases
- Maintaining current network topology maps
- Monitoring how routes change over time
- Identifying reliable vs. unreliable routes
- Debugging mesh connectivity issues
- Analyzing network health and performance
Best Practices
- Use longer intervals (10-15 minutes) for stable networks
- Use shorter intervals (3-5 minutes) only when actively troubleshooting
- Disable during periods of high network activity
- Consider disabling on battery-powered devices to conserve power
Related Meshtastic Documentation
Traceroute uses Meshtastic's routing protocol. For more information:
Auto Remote LocalStats
New in 4.10
Periodically requests local_stats telemetry — noise floor, channel/air utilization, uptime, and packet counts — from remote nodes, so you can graph the health of infrastructure you don't physically own. Replies persist through the normal telemetry pipeline and appear on the same charts as your own device metrics.
How It Works
A round-robin scheduler polls one least-recently-polled target per tick, so the load is spread out over time rather than fired in a burst. Each request is sent as a unicast on the target's channel (using the shared channel PSK), not as a PKI direct message. This is deliberate:
- A unicast bypasses the firmware's multi-hop-broadcast role gate, so
REPEATERandCLIENTnodes will answer (a broadcast request would be ignored by exactly the infrastructure nodes you most want to monitor). - Channel routing uses the shared PSK, which avoids the stale-key fragility of a PKI DM when keys don't line up.
hop_limit is sized to each target's observed distance, the explicit local_stats telemetry variant is requested (the firmware echoes the requested variant), and the scheduler is passive-mode aware — it stops transmitting when MeshMonitor is in passive mode.
Configuration
Navigate to Automation → Auto Remote LocalStats.
Enable/Disable: Toggle the checkbox next to "Auto Remote LocalStats"
Interval: How often the scheduler ticks (applied live, no restart needed).
Target filters — targets are the union of every enabled filter, so a node matching any one is polled:
- Node list — an explicit set of nodes.
- Role — e.g. all
REPEATER/ROUTERnodes. - Favorites — every node flagged as a favorite.
- Name regex — match nodes by a regular expression over their name.
Built-in guards keep it polite to the mesh: per-tick jitter, a schedule window, an airtime gate, and a minimum-interval rate limit per target.
Side Effects
- Airtime Usage: each request and reply consumes LoRa airtime; the airtime gate and round-robin pacing keep this bounded.
- Network Congestion: remote nodes relay the request and their reply across the mesh — prefer longer intervals on large networks.
- Battery Impact: polled nodes transmit a reply, increasing their power use.
Use Cases
- Watching channel utilization on a key repeater two hops away.
- Graphing noise floor across your infrastructure to spot rising interference.
- Tracking uptime/packet counts of nodes you don't have physical access to.
Best Practices
- Start with role or favorites filters rather than polling every node.
- Use longer intervals on dense meshes; the per-target rate limit prevents hammering any one node.
- Pair with Noise Floor telemetry to chart remote interference over time.
Auto Ping
Allows mesh users to trigger automated ping sessions via direct message commands. This is useful for testing link quality, measuring round-trip times, and verifying connectivity to the MeshMonitor node over time.
How It Works
When enabled, mesh users can send a direct message to the MeshMonitor node with the command ping N (where N is the number of pings). MeshMonitor then sends N pings back to the requesting node at the configured interval, tracking ACK/NAK/timeout results for each ping. After all pings complete (or the user cancels), MeshMonitor sends a summary DM with the results.
Pings use Meshtastic's NODEINFO_APP request with wantResponse: true, which is the standard Meshtastic ping mechanism — the target must respond with an ACK and NodeInfo, giving round-trip confirmation.
DM Commands
| Command | Description |
|---|---|
ping N | Start N pings to the MeshMonitor node (N is capped at the configured maximum) |
ping stop | Cancel an active ping session |
Examples:
- Send
ping 5as a DM to start 5 pings at the configured interval - Send
ping stopto cancel an active session before it completes
Configuration
Navigate to Settings > Automation and find the Auto Ping section.
Enable/Disable: Toggle the checkbox next to "Auto Ping"
| Setting | Description | Default | Range |
|---|---|---|---|
| Enable | Turn auto-ping on or off | Off | — |
| Ping Interval | Time between each ping in a session (seconds) | 30 | 10–300 |
| Max Pings Per Session | Maximum number of pings a user can request in a single session | 20 | 1–100 |
| Ping Timeout | How long to wait for a response before marking a ping as timed out (seconds) | 60 | 10–300 |
Active Sessions
The Auto Ping settings panel displays a live table of active ping sessions, showing:
- Requested By: The node that initiated the ping session
- Progress: How many pings have completed out of the total (e.g., 3/5)
- Successful: Number of pings that received an ACK
- Failed: Number of pings that received a NAK or timed out
- Elapsed: Time since the session started
- Stop: Button to force-stop a session from the UI
Sessions update in real-time via WebSocket events. Admins can force-stop any active session from the UI.
Session Lifecycle
- A mesh user sends
ping 5as a DM to MeshMonitor - MeshMonitor confirms: "Starting 5 pings every 30s..."
- After one full interval, the first ping is sent
- Each ping waits for an ACK, NAK, or timeout before the next interval
- After all pings complete, MeshMonitor sends a summary DM: "Auto-ping complete: 4/5 successful (80%)"
- If the user sends
ping stopduring a session, the session is cancelled and a partial summary is sent
Side Effects
- Network Traffic: Each ping generates a NODEINFO request and expects a response, using mesh airtime
- One Session Per User: Each node can only have one active ping session at a time
- DM Only: Auto-ping commands are only processed when received as direct messages
- Command Priority: Auto-ping commands are processed before Auto Responder triggers, so
pingpatterns in Auto Responder won't conflict
Use Cases
- Link Quality Testing: Measure packet delivery rates between a remote node and MeshMonitor over time
- Latency Measurement: Track round-trip times across multiple pings to assess network performance
- Connectivity Verification: Confirm that a node can reliably reach MeshMonitor through the mesh
- Troubleshooting: Diagnose intermittent connectivity issues with repeated ping tests
Best Practices
- Interval Selection: Use the default 30-second interval for most cases; shorter intervals increase airtime usage
- Ping Count: Start with 5–10 pings for quick tests; use higher counts (20+) for sustained reliability testing
- Timeout: The default 60-second timeout is generous enough for multi-hop networks; reduce it for direct connections
- Max Pings: Set the maximum to a reasonable value (20–50) to prevent excessive network usage from long sessions
Troubleshooting
"ping 5" not working:
- Verify Auto Ping is enabled in the Automation settings
- Ensure the command is sent as a direct message (not on a channel)
- Check that the number doesn't exceed the configured maximum
All pings timing out:
- The target node may be out of range or unreachable
- Check mesh connectivity to the MeshMonitor node
- Try increasing the timeout value
Session not appearing in UI:
- Refresh the browser page
- Verify you have
settings:readpermission to view the Automation tab
Permissions
- UI Settings: Requires
settings:readto view,settings:writeto modify configuration or force-stop sessions - DM Commands: Any mesh user can trigger a ping session (feature gated by the
autoPingEnabledsetting)
Remote Admin Scanner
Automatically discovers which nodes in your mesh network have remote administration capabilities enabled. This helps you identify nodes that can be managed remotely through MeshMonitor's Admin Commands feature.
How It Works
When enabled, MeshMonitor periodically scans active nodes to determine if they have remote admin access enabled. The scanner:
- Identifies nodes with public keys (required for secure admin communication)
- Sends a device metadata request to each node
- Waits for a response (nodes without admin access will not respond)
- Records the result for each node
Scan results are displayed in the Node Details panel and can be used to quickly identify which nodes support remote administration.
Configuration
Enable/Disable: Toggle the checkbox next to "Remote Admin Scanner"
Scan Interval: How often to check nodes for admin capability
- Range: 1-60 minutes
- Default: 5 minutes
- Recommendation: Use longer intervals (10-15 minutes) for larger networks to reduce mesh traffic
Result Expiration: How long scan results remain valid before a node needs to be re-scanned
- Range: 24-168 hours (1-7 days)
- Default: 168 hours (7 days)
- Purpose: Prevents re-scanning nodes that were recently checked
Stats Panel
The scanner displays real-time statistics:
- Nodes with Admin: Number of nodes confirmed to have remote admin enabled
- Nodes Checked: Total nodes that have been scanned
- Eligible Nodes: Nodes with public keys (candidates for scanning)
Scan Log
When enabled, a scan log shows recent scan activity:
- Timestamp: When the node was last checked
- Node: The node name and ID
- Status: ✓ (green) for admin available, ✗ (red) for no admin
- Firmware: Device firmware version (if admin is available)
Node Details Integration
Scan results appear in the Node Details panel for each node:
- Available: Remote admin is enabled with the date it was verified
- Unavailable: Remote admin is not enabled with the date it was checked
- Unknown: Node has never been scanned
Side Effects
- Network Traffic: Each scan generates admin protocol packets
- Response Time: Scans wait up to 45 seconds for node responses
- Battery Impact: Scanning causes nodes to process admin requests
- Airtime Usage: Uses encrypted admin channel airtime
Use Cases
- Network Discovery: Identify all remotely manageable nodes in your mesh
- Security Auditing: Find nodes with admin access that may need securing
- Fleet Management: Quickly see which nodes can be configured remotely
- Troubleshooting: Verify if a node's admin access is working
Best Practices
- Interval Selection: Use longer intervals for stable networks
- Expiration Period: Shorter expiration for networks with frequent changes
- Off-Peak Scanning: Consider disabling during high network activity
- Review Results: Periodically check for unexpected admin-enabled nodes
Troubleshooting
No Nodes Being Scanned:
- Verify nodes have public keys (required for admin communication)
- Check that nodes are "active" (heard within the configured maxNodeAgeHours)
- Ensure the scanner is enabled and saved
All Scans Failing:
- Remote admin may not be enabled on target nodes
- Nodes may be too far away or unreachable
- Check mesh connectivity to target nodes
Scan Log Not Showing:
- Ensure the scanner checkbox is enabled
- Refresh the browser page
- Check that scans have had time to complete (45+ seconds per node)
Related Documentation
- Admin Commands - Use remote admin to configure nodes
- Security - Learn about node security and encryption
Auto Time Sync
Automatically synchronizes the MeshMonitor server's clock to nodes in your mesh network that support remote administration. This keeps node clocks accurate, which is important for proper message ordering and timestamp display.
How It Works
When enabled, MeshMonitor periodically selects one eligible node that needs a time sync and sends it a Set Time admin command with the server's current time. The scheduler processes one node per interval tick, cycling through all eligible nodes over time.
A node is eligible for time sync if:
- It has been discovered by the Remote Admin Scanner (has remote admin capability), or it is the local node
- Its last time sync is older than the configured expiration period (or it has never been synced)
- Optionally, it is included in the node filter list (when filtering is enabled)
Configuration
Navigate to Settings > Automation and find the Auto Time Sync section.
| Setting | Description | Default | Range |
|---|---|---|---|
| Enable | Turn auto time sync on or off | Off | - |
| Interval | How often to sync the next eligible node (in minutes) | 60 | 15 - 1440 |
| Expiration | How many hours before a previously synced node becomes eligible again | 24 | 1 - 24 |
| Filter to specific nodes | When enabled, only sync nodes in the selected list | Off | - |
Node Filter
When the node filter is enabled, you can select which specific nodes should receive time syncs. The node list shows only nodes with remote admin capability. Use the Select All / Deselect All buttons and the search field to manage the list.
When the filter is disabled (default), all eligible nodes are included automatically.
Prerequisites
- Remote Admin Scanner must be enabled and must have discovered nodes with remote admin capability before Auto Time Sync can target them
- MeshMonitor must be connected to a Meshtastic node
Use Cases
- Keeping node clocks accurate - Nodes without GPS or NTP may drift over time; periodic syncing corrects this
- Consistent timestamps - Ensures messages across the mesh have accurate, comparable timestamps
- Automated maintenance - Set it and forget it; the scheduler handles all nodes over time
Best Practices
- Start with the default 60-minute interval; there is no need to sync more frequently unless nodes drift quickly
- Use a 24-hour expiration so each node gets synced roughly once per day
- If you have a large mesh, the scheduler will cycle through all nodes automatically — one per interval tick
- Use the node filter if you only want to sync specific nodes (e.g., solar-powered nodes that lose time on reboot)
Related Documentation
- Remote Admin Scanner - Required to discover nodes with remote admin capability
- Admin Commands - Manual admin commands including Set Time
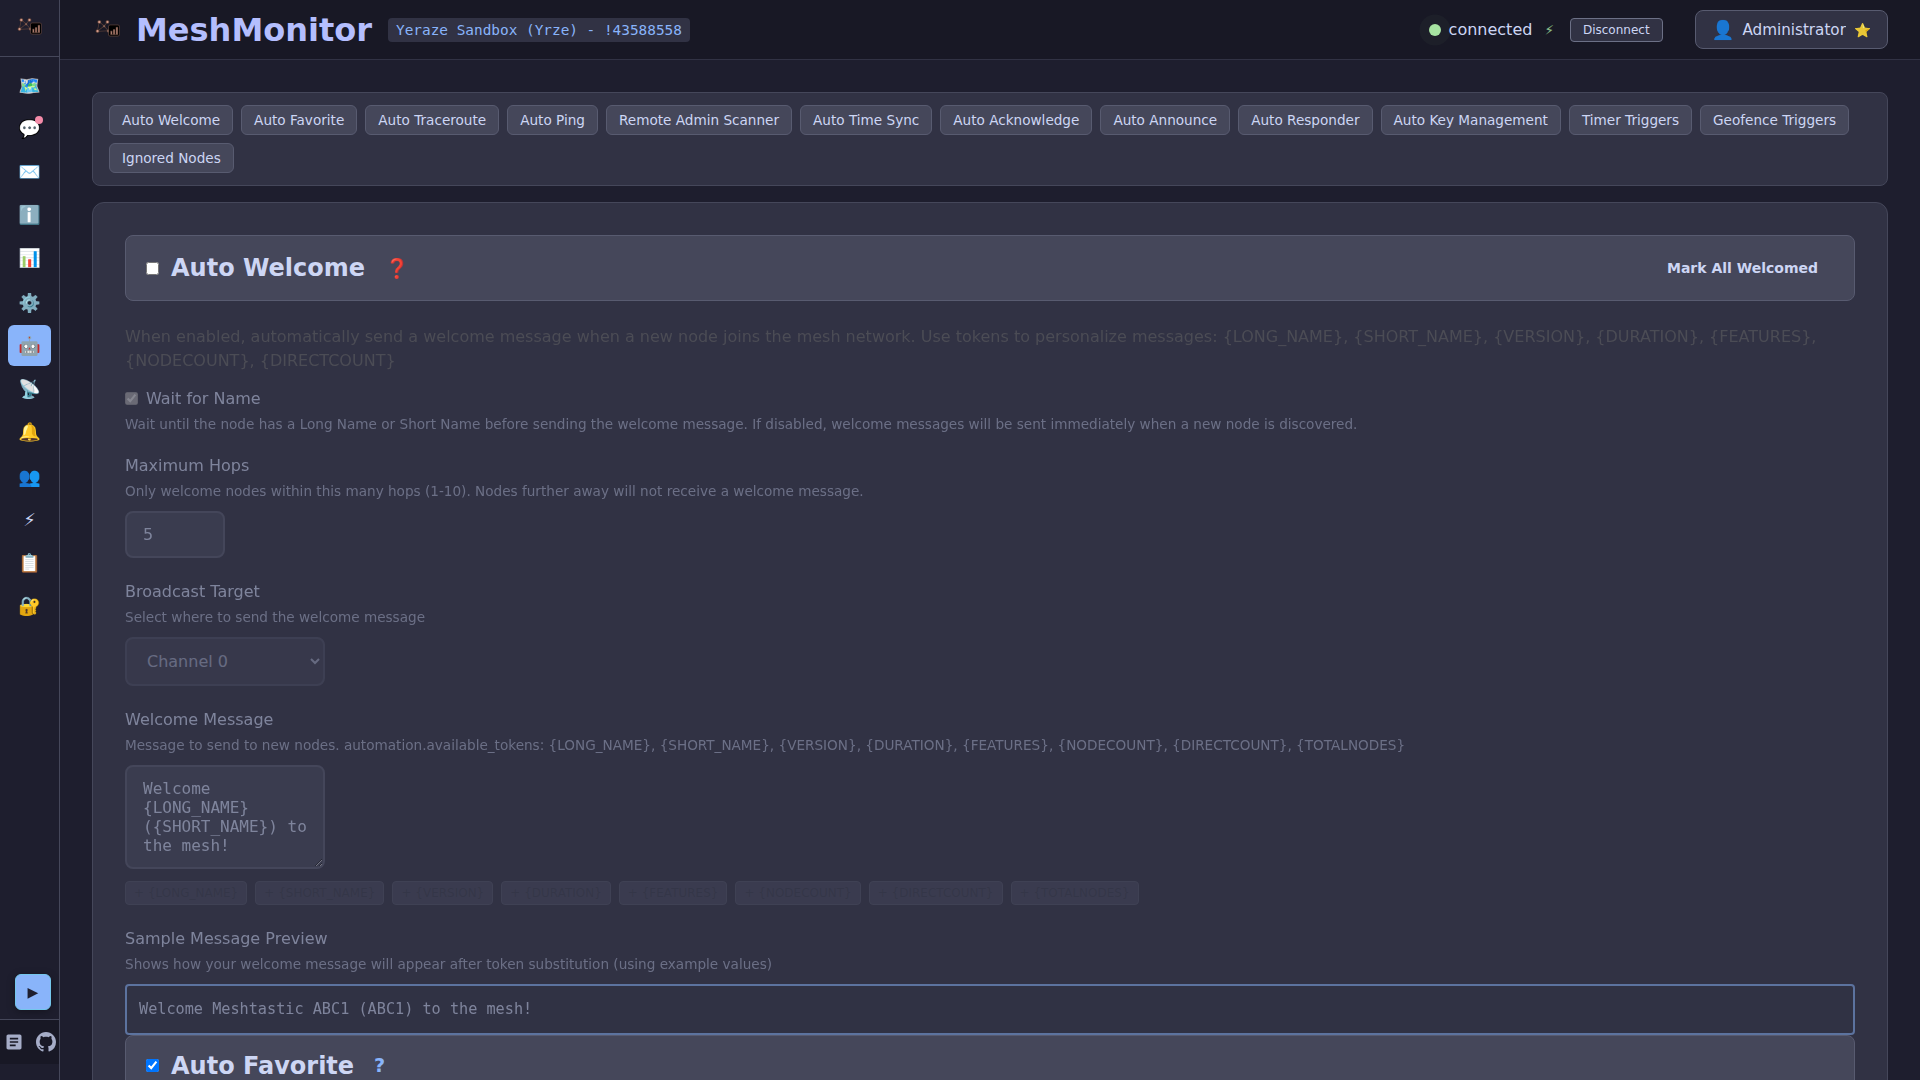
Auto Welcome
Automatically sends a personalized welcome message to new nodes when they join your mesh network.
How It Works
When enabled, MeshMonitor monitors for nodes that appear for the first time in the mesh network. When a new node is detected, it automatically sends a direct message to welcome them with your custom template.
Configuration
Enable/Disable: Toggle the checkbox next to "Auto Welcome"
Welcome Channel: Select which channel to monitor for new nodes
- Primary: Monitor only the primary channel (most common)
- All Channels: Monitor all channels for new nodes
- Choose the channel where you expect new users to appear
Maximum Hops Filter: Limit welcome messages to nodes within a specific hop range
- Range: 0-7 hops
- Default: 7 (all nodes)
- Purpose: Prevents welcoming distant nodes that may not be regular network participants
- Use Cases:
- Set to 0-1 for welcoming only direct neighbors
- Set to 2-3 for local network participants
- Set to 7 to welcome all nodes regardless of distance
- Benefits:
- Reduces unnecessary mesh traffic for distant nodes
- Focuses welcomes on local/active participants
- Helps manage network congestion in large meshes
Custom Welcome Message: Craft your welcome message using dynamic tokens:
{LONG_NAME}: Long name of the new node joining (e.g., "Alice's Node"){NODEID}: Hex ID of the new node (e.g., "!a2b3c4d5"){DATE}: Date when the node was first seen (e.g., "1/15/2025"){TIME}: Time when the node was first seen (e.g., "2:30:00 PM"){VERSION}: Your MeshMonitor version (e.g., "v2.11.3")
Default Template:
👋 Welcome {LONG_NAME}! Thanks for joining the mesh.Example Custom Templates:
🎉 Hey {LONG_NAME}! Welcome to our mesh network on {DATE} at {TIME}👋 Welcome aboard {LONG_NAME} ({NODEID})! Check meshmonitor.org for network stats.🌐 New node detected: {LONG_NAME}. MeshMonitor {VERSION} is watching!Token Insertion: Click on any token button to insert it at your cursor position for easy template creation.
Side Effects
- Network Traffic: Each welcome message consumes airtime and generates mesh traffic
- Privacy: Welcome messages are sent as direct messages to the new node
- Spam Protection: Built-in 24-hour cooldown prevents re-welcoming the same node
- First Join Only: Only triggers when a node is seen for the very first time
Use Cases
- Welcoming new members to your community mesh
- Providing network information or guidelines to newcomers
- Announcing the presence of MeshMonitor monitoring
- Building a friendly mesh community atmosphere
Best Practices
- Keep messages concise and friendly
- Include useful information (network rules, contact info, website)
- Test your template with the token preview before enabling
- Consider what information would be helpful to a new user
Related Meshtastic Documentation
Auto Welcome uses Meshtastic's direct messaging. For more information:
Auto Announce
Automatically broadcasts periodic announcement messages to a selected channel.
How It Works
When enabled, MeshMonitor sends a scheduled message to the configured channel at the specified interval. The message can include dynamic tokens that are replaced with current system information.
Configuration
Enable/Disable: Toggle the checkbox next to "Auto Announce"
Announcement Interval: How often to broadcast the announcement
- Range: 3-24 hours
- Default: 6 hours
- Recommendation: Use longer intervals (6-12 hours) to avoid annoying mesh users
Scheduled Sends: Use cron expressions for precise scheduling
- Enable/Disable: Toggle the "Use Scheduled Sends" checkbox
- Cron Expression: When enabled, replaces the interval-based scheduling with precise time-based scheduling
- Default Expression:
0 */6 * * *(every 6 hours at the top of the hour) - Validation: Live validation with visual feedback (green checkmark for valid expressions, red error for invalid)
- Cron Helper: Click the link to crontab.guru for assistance building cron expressions
- Format: Standard 5-field cron format (minute hour day month weekday)
- Examples:
0 */6 * * *- Every 6 hours at minute 0 (12:00 AM, 6:00 AM, 12:00 PM, 6:00 PM)0 9 * * *- Every day at 9:00 AM0 12 * * 1- Every Monday at noon30 8,20 * * *- 8:30 AM and 8:30 PM daily0 0 1 * *- First day of every month at midnight
- UI Behavior: When scheduled sends is enabled, the "Send every X hours" setting is hidden
- Immediate Apply: Changes to the cron schedule take effect immediately without requiring a container restart
Announce on Start: When enabled, automatically sends an announcement when the container starts
- Includes 1-hour spam protection to prevent network flooding during container restarts
- Useful for notifying the network that MeshMonitor is back online after maintenance
Broadcast Channel: Select which channel to send announcements on
- Choose from any available channel on your device
- Typically use the Primary channel or a dedicated announcements channel
- Avoid using channels meant for private or sensitive communications
Announcement Message: The text to broadcast. Supports dynamic tokens:
{VERSION}: Current MeshMonitor version (e.g., "v2.2.2"){DURATION}: System uptime (e.g., "2 days, 5 hours"){FEATURES}: Enabled automation features as emojis (e.g., "🗺️ 🤖")- 🗺️ = Auto Traceroute enabled
- 🤖 = Auto Acknowledge enabled
- 📢 = Auto Announce enabled
{NODECOUNT}: Number of active nodes (e.g., "42 nodes"){DIRECTCOUNT}: Number of direct nodes at 0 hops{DATE}: Current date when the announcement is sent, formatted per your Date Format preference (e.g., "1/15/2025"){TIME}: Current time when the announcement is sent, formatted per your Time Format preference (e.g., "2:30 PM")
Default Message:
MeshMonitor {VERSION} online for {DURATION} {FEATURES}Side Effects
- Network Traffic: Each announcement consumes airtime and generates mesh traffic
- User Annoyance: Too-frequent announcements may be seen as spam by mesh users
- Immediate Apply: Changes to announce settings (interval, cron schedule, enabled/disabled) take effect immediately without requiring a container restart
- Channel Impact: Announcement messages appear in the selected channel for all users
Use Cases
- Notifying mesh users of MeshMonitor availability
- Sharing network statistics periodically
- Announcing system features and capabilities
- Providing automated status updates
Best Practices
- Keep messages concise to minimize airtime usage
- Use intervals of 6-12 hours to avoid spam, or use cron expressions for precise scheduling
- Use cron expressions for precise timing (e.g., daily at 9 AM instead of every 6 hours)
- Consider time zones when scheduling (container timezone applies to cron expressions)
- Include useful information using tokens
- Test messages with "Send Now" before enabling automatic scheduling
- Be considerate of other mesh users
Send Now Button
The "Send Now" button allows you to manually trigger an announcement immediately without waiting for the next scheduled interval. This is useful for:
- Testing your message format
- Announcing system maintenance or updates
- Verifying channel configuration
Related Meshtastic Documentation
Auto Announce uses Meshtastic's channel messaging. For more information:
Auto Responder
Automatically responds to messages matching custom trigger patterns with either text or HTTP requests. This powerful feature enables creating bot-like functionality such as weather information, node status, or custom commands.
How It Works
When enabled, MeshMonitor monitors all incoming messages for patterns matching your configured triggers. When a message matches, it either sends a text response with extracted parameters or makes an HTTP request to an external service with the extracted data.
Configuration
Enable/Disable: Toggle the checkbox next to "Auto Responder"
Triggers: Create custom trigger patterns that match specific message formats
Each trigger consists of:
- Trigger Pattern: The message pattern to match (e.g., "weather {location}")
- Response Type: Either "text" (send a message) or "http" (make an HTTP request)
- Response: The action to take when triggered
Trigger Patterns
Trigger patterns can include parameters using curly braces {parameter} that extract information from messages:
Basic Examples:
weather {location}- Matches "weather miami" or "weather new york"w {city},{state}- Matches "w parkland,fl" or "w austin,tx"status {nodeid}- Matches "status !a1b2c3d4"hello- Simple pattern with no parameters
Pattern Matching:
- Case insensitive by default
- Parameters match any non-whitespace characters by default
- Parameters support commas and special characters (e.g., "parkland,fl")
- Patterns are matched against the entire message
Multiple Patterns Per Trigger
You can specify multiple patterns for a single trigger by separating them with commas. This allows one trigger to match different message formats:
Examples:
ask, ask {message}- Matches both "ask" (shows help) and "ask {message}" (processes the message)help, help {command}- Matches "help" (general help) and "help weather" (command-specific help)temp, temp {value:\d+}- Matches "temp" (current temp) and "temp 72" (set temp to 72)
Usage: Enter patterns separated by commas in the trigger field: ask, ask {message}
Regex Pattern Examples
You can specify custom regex patterns for parameters using {paramName:regex} syntax for more precise matching:
Numeric Patterns:
w {zip:\d{5}}- Matches only 5-digit zip codes (e.g., "w 33076")temp {value:\d+}- Matches only numeric values (e.g., "temp 72", but not "temp hot")set {num:-?\d+}- Matches positive or negative integers (e.g., "set 42" or "set -42")
Decimal Patterns:
coords {lat:-?\d+\.?\d*},{lon:-?\d+\.?\d*}- Matches decimal coordinates (e.g., "coords 40.7128,-74.0060")
Multi-word Patterns:
weather {location:[\w\s]+}- Matches locations with spaces (e.g., "weather new york")alert {message:.+}- Matches everything including punctuation (e.g., "alert Hello, world!")
Common Regex Patterns:
\d+- One or more digits\d{5}- Exactly 5 digits[\w\s]+- Word characters and spaces.+- Any character (including spaces and punctuation)-?\d+\.?\d*- Optional negative sign, digits, optional decimal point and digits
Note: Remember to escape special regex characters if they appear in your pattern: \ . + * ? ^ $ { } [ ] ( ) |
Response Types
Text Response: Sends a message back to the sender
- Supports multiline text (automatically uses textarea for editing)
- Can include extracted parameters using
{parameter}syntax - Multiline Support: Enable to automatically split long responses into multiple messages
- Can output single or multiple responses (see Multiple Responses Support)
- Example trigger:
hello {name} - Example response:
Hi {name}! Welcome to the mesh.
HTTP Response: Makes an HTTP GET request to an external service
- URL can include extracted parameters using
{parameter}syntax - URL also supports all acknowledgement/announcement tokens (e.g.,
{NODE_ID},{SHORT_NAME},{HOPS},{SNR},{RSSI},{CHANNEL},{VERSION}, etc.) - token values are automatically URI-encoded for URL safety - Extracted parameters from regex capture groups take precedence over built-in tokens of the same name
- Multiline Support: Enable to automatically split long responses into multiple messages
- Can output single or multiple responses (see Multiple Responses Support)
- Useful for triggering webhooks, APIs, or external automation
- Example trigger:
alert {message} - Example response:
https://api.example.com/alert?msg={message}&node={NODE_ID}&snr={SNR}
Script Response: Executes a custom script for advanced logic
- Scripts must be placed in
/data/scripts/directory - Supports Node.js (
.js,.mjs), Python (.py), and Shell (.sh) scripts - Scripts receive message data and parameters via environment variables
- Can output single or multiple responses (see Script Response Details below)
- 30-second execution timeout
- Script Arguments: Optional command-line arguments with token expansion (see below)
- Example trigger:
weather {location} - Example response:
/data/scripts/weather.py
Mailbox Response (Dead Drop): A built-in asynchronous message store — "mesh voicemail"
- A node DMs the radio
msg <name> <text>and MeshMonitor holds the message until the named recipient retrieves it withinbox/inbox play— the recipient need not be online when the message is sent - No response text is needed; the mailbox parses the commands itself
- DM-only by design; set the trigger's channels to Direct Messages only
- See Mailbox (Dead Drop) below for the full command set and configuration
- Example trigger pattern:
msg {recipient} {body:.+},inbox,inbox play {sender},inbox play,inbox delete {id},inbox clear
Mailbox (Dead Drop)
The Mailbox response type turns the connected node into an asynchronous message drop — think mesh voicemail. A sender leaves a message addressed to another node by name; that node collects it later with inbox / inbox play. All state is per-source (each connected radio keeps its own mailbox) and is stored in the database (dead_drop_messages table), so it survives restarts.
Commands
All commands are sent as direct messages to the node running the mailbox:
| Command | Description |
|---|---|
msg <name> <text> | Store a message for <name> (short name, long name, or !nodeid) |
inbox | Show how many messages are waiting and from whom |
inbox play | Release up to 5 of the oldest messages (header + body per message) |
inbox play <name> | Release only messages from a specific sender |
inbox delete <id> | Delete one message by its 4-character id |
inbox clear | Delete all messages you have already played |
How recipient matching works
A message is addressed to a name as typed by the sender. When a node retrieves its inbox, the mailbox matches that stored name against any identity form of the requesting node — its short name, long name, node id (!hex), or node number. The requester proves its identity through the direct-message sender context, so there is no fragile store-time node lookup. Names are matched case-insensitively.
Delivery format
Metadata and body are sent as separate messages, so a near-200-byte body is never truncated by a prefixed header:
MSG 1/2 from ALLF, 14m ago, id 6458
antenna mount loose
MSG 2/2 from ZNOF, 3m ago, id C22D
router back online after battery swap
2 delivered. Reply 'inbox clear' to delete.Limits and expiry
| Limit | Default |
|---|---|
| Max message body | 180 bytes (UTF-8) |
Messages per inbox play | 5 (oldest first) |
| Pending per recipient | 20 |
| Pending per sender | 20 |
| Message expiry | 7 days |
Configuration
- Open Automation → Auto Responder for the source whose node should host the mailbox.
- Add a trigger:
- Type: Mailbox
- Channels: Direct Messages only
- Trigger pattern:
msg {recipient} {body:.+},inbox,inbox play {sender},inbox play,inbox delete {id},inbox clear - Cooldown: not needed — the mailbox is interactive (e.g.
inboxtheninbox playa second apart) and bypasses the per-node cooldown, so any value here is ignored for this trigger. - Verify response: recommended on. A stored message is only marked played once the radio confirms delivery of its body line. With Verify response off, a single unacknowledged send can still count as delivered, so a voicemail could be marked played even if it never reached the recipient. Enabling it (the default) makes an undelivered body resurface on the next
inbox play.
- Click Add, then Save.
No response text is required — the Add button enables once the trigger pattern is valid.
Script Arguments (Auto Responder)
When using Script responses, you can pass command-line arguments to scripts via the Arguments field. Arguments support token expansion, allowing dynamic values to be injected at runtime.
Example Arguments:
--reboot- Pass a simple flag--set lora.region US- Pass a setting and value--dest {NODE_ID} --reboot- Use token expansion--ip {IP} --verbose- Include the node IP address
Available Tokens:
| Token | Description | Example |
|---|---|---|
{NODE_ID} | Sender's node ID | !a1b2c3d4 |
{LONG_NAME} | Sender's long name | Alice's Node |
{SHORT_NAME} | Sender's short name | ALI |
{IP} | Meshtastic node IP | 192.168.1.100 |
{PORT} | Meshtastic TCP port | 4403 |
{VERSION} | MeshMonitor version | v3.4.0 |
{NODECOUNT} | Active node count | 42 |
{HOPS} | Message hop count | 2 |
{SNR} | Signal-to-noise ratio | 7.5 |
{RSSI} | Signal strength | -95 |
{LAST_HOP} | Last relay node (short name → hex byte → unknown) | RLY1 |
Example Configuration:
Trigger: reboot {nodeid}
Response Type: script
Response: /data/scripts/remote-admin.py
Arguments: --dest {nodeid} --rebootWhen someone sends "reboot !abc12345", the script is called with arguments --dest !abc12345 --reboot.
Multiline Support
For Text and HTTP response types, you can enable multiline support to automatically split long responses into multiple messages. This feature is useful when responses exceed the 200-character limit.
How It Works:
When multiline is enabled, responses are intelligently split using the following priority:
Line Breaks (if using >50% of available space)
- Splits on
\ncharacters - Best for pre-formatted multi-paragraph responses
- Splits on
Sentence Endings (if using >50% of space)
- Splits after
.,!, or? - Keeps complete sentences together
- Splits after
Punctuation (if using >50% of space)
- Splits after
,,;,:, or- - Preserves clause boundaries
- Splits after
Spaces (if using >30% of space)
- Splits at word boundaries
- Avoids cutting words in half
Hyphens (if using >30% of space)
- Splits at hyphenated words
- Last resort before character splitting
Character Split (if no better option)
- Splits at exactly 200 characters
- Only used when absolutely necessary
Message Queue Behavior:
Each split message is:
- Queued individually
- Sent with 30-second intervals between messages
- Retried up to 3 times on failure
- Tracked for ACK delivery confirmation
Example:
Trigger: help
Response Type: text
Multiline: ✓ Enabled
Response:
Welcome to our mesh bot! Available commands:
- weather {location}: Get weather info
- status {nodeid}: Check node status
- ping: Test connectivity
For more info visit meshmonitor.orgThis would be split into approximately 3 messages, each sent 30 seconds apart.
When to Use Multiline:
- Help text with multiple commands
- Long informational responses
- Multi-paragraph announcements
- Formatted lists or instructions
When NOT to Use Multiline:
- Simple acknowledgments
- Short status updates
- Time-sensitive responses
- Single-line messages
Multiple Responses Support
For Text, HTTP and Script response types, you can return single or multiple responses, using JSON.
JSON Output Format:
Single Response:
{
  "response": "Your response text (max 200 chars)"
}Multiple Responses:
{
  "responses": [
    "First message (max 200 chars)",
    "Second message (max 200 chars)",
    "Third message (max 200 chars)"
  ]
}When using multiple responses, each message is queued individually and sent with:
- 30-second rate limiting between messages
- Up to 3 retry attempts per message
- Automatic ACK tracking for delivery confirmation
Optional fields:
| Field | Type | Applies to | Effect |
|---|---|---|---|
response | string | Text, HTTP, Script | Single message body (≤ 200 chars). |
responses | string[] | Text, HTTP, Script | Multiple message bodies (each ≤ 200 chars). Wins over response if both are present. |
private | boolean | Text, HTTP, Script | Force DM routing (true) or channel routing (false) regardless of where the trigger fired. Omit to keep the default ("reply on the same channel the trigger arrived on"). |
Interaction with the multiline trigger option:
multiline=trueonly splits when the payload is a single response (plain text or{"response": "…"}). Each item in a{"responses": [...]}array is treated as already-chunked: items longer than 200 chars are truncated, not split. Pre-chunk your own messages when returning the array form.multiline=false(default) truncates every response to 200 chars.
HTTP responses that aren't MeshMonitor-shaped JSON:
If an HTTP endpoint returns a body that parses as JSON but doesn't have response / responses (e.g. {"status":"ok"} from a webhook acknowledgment), the entire raw body is used as the single response message — same behaviour as a plain-text body. Only the script path treats this as an error.
Parameter Extraction
Parameters are automatically extracted from the incoming message and can be used in responses:
Example 1 - Weather Bot:
Trigger: weather {location}
Response Type: http
Response: https://api.weather.com/lookup?q={location}When someone sends "weather miami", MeshMonitor makes a request to: https://api.weather.com/lookup?q=miami
Example 2 - Greeting Bot:
Trigger: hello {name}
Response Type: text
Response: Hey {name}! Thanks for saying hello. Welcome to our mesh network!When someone sends "hello Alice", MeshMonitor replies: Hey Alice! Thanks for saying hello. Welcome to our mesh network!
Example 3 - Multi-Parameter:
Trigger: w {city},{state}
Response Type: text
Response: Looking up weather for {city}, {state}...When someone sends "w parkland,fl", MeshMonitor replies: Looking up weather for parkland, fl...
Script Response Details
Scripts provide the most powerful and flexible response type, allowing you to execute custom logic, call external APIs, query databases, or perform complex calculations.
Setting Up Scripts:
- Create Your Script: Write a script in Node.js, Python, or Shell
- Copy to Container: Place the script in
/data/scripts/directory - Make Executable: Ensure the script has execute permissions
- Configure Trigger: Set response type to "Script" and enter the full path
Script Requirements:
Scripts must:
- Be located in
/data/scripts/directory - Have a supported extension:
.js,.mjs,.py, or.sh - Output valid JSON to stdout with a
responseorresponsesfield (see details in Multiple Responses Support section) - Complete execution within 30 seconds (timeout)
- Handle errors gracefully
Environment Variables:
All scripts receive these environment variables:
MESSAGE: Full message text receivedFROM_NODE: Sender's node numberNODE_ID: Sender's node ID (hex format, e.g.,!a2e4ff4c)LONG_NAME/SHORT_NAME: Sender's node namesHOPS: Number of hops the message traveledSNR/RSSI: Signal quality of received packetCHANNEL: Channel number the message was received onVERSION: Sender's firmware versionNODECOUNT: Number of active nodes on the meshVIA_MQTT: Whether message arrived via MQTT bridgeIS_DIRECT: Whether the message is a direct messageMESHTASTIC_IP/MESHTASTIC_PORT: Connected node addressPACKET_ID: Message packet IDTRIGGER: The trigger pattern that matchedPARAM_*: Extracted parameters (e.g.,PARAM_location,PARAM_name)MSG_*: All message fields as individual variables
See the Auto Responder Scripting Guide for the complete list.
Example 1 - Node.js Weather Script:
#!/usr/bin/env node

const location = process.env.PARAM_location || 'Unknown';

// In production, call a real weather API
const response = {
  response: `Weather for ${location}: Sunny, 72°F`
};

console.log(JSON.stringify(response));Trigger Configuration:
Trigger: weather {location}
Response Type: script
Response: /data/scripts/weather.jsExample 2 - Python Script with API Call:
#!/usr/bin/env python3
import os
import json
import urllib.request

location = os.environ.get('PARAM_location', 'Unknown')

try:
    # Call weather API
    url = f"https://wttr.in/{location}?format=3"
    with urllib.request.urlopen(url, timeout=5) as response:
        weather_data = response.read().decode('utf-8').strip()

    output = {"response": weather_data}
except Exception as e:
    output = {"response": f"Weather lookup failed for {location}"}

print(json.dumps(output))Example 3 - Shell Script:
#!/bin/sh

NAME="${PARAM_name:-stranger}"

cat <<EOF
{
  "response": "Hello ${NAME}! From node ${FROM_NODE}"
}
EOFCopying Scripts to Container:
# Copy a single script
docker cp weather.py meshmonitor:/data/scripts/

# Copy multiple scripts
docker cp scripts/ meshmonitor:/data/

# Make scripts executable
docker exec meshmonitor chmod +x /data/scripts/*.pyDebugging Scripts:
View execution logs:
docker logs -f meshmonitorScripts can write debug info to stderr (visible in logs):
console.error('Debug info:', variable); // Node.jsprint(f'Debug: {variable}', file=sys.stderr) # Pythonecho "Debug: $VARIABLE" >&2 # ShellScript Security:
- Scripts are sandboxed to
/data/scripts/directory - Path traversal attempts (
..) are blocked - Scripts run with container user permissions (not root)
- 30-second execution timeout prevents runaway scripts
- Output limited to 1MB to prevent memory issues
Performance Tips:
- Keep scripts fast (< 1 second preferred)
- Cache external API results when possible
- Use async I/O for network requests
- Test scripts locally before deployment
- Monitor container logs for errors
Example Scripts:
The MeshMonitor repository includes example scripts in examples/auto-responder-scripts/:
hello.js- Simple Node.js greeting script with parameter extractionweather.py- Python weather lookup template with API callPirateWeather.py- Complete Pirate Weather API integration with Nominatim geocoding supportinfo.sh- Shell script showing system infolorem.js/py/sh- Multi-response examples that send 3 Lorem Ipsum messages
The lorem examples demonstrate the multiple responses feature where a script returns an array of messages that are queued and sent individually with rate limiting.
See the examples/auto-responder-scripts/README.md for detailed documentation.
Managing Triggers
Adding Triggers:
- Enter your trigger pattern (e.g., "weather {location}")
- Select response type (text, http, or script)
- Enter your response (text message, URL, or script path)
- Click "Add Trigger"
Editing Triggers:
- Click the "Edit" button next to any trigger
- Modify the pattern, type, or response
- Click "Save" to apply changes or "Cancel" to discard
- Edited triggers show a blue border while in edit mode
Removing Triggers:
- Click the "Remove" button next to any trigger
Multiline Text Support:
- Text responses automatically use a multiline textarea
- Supports 3+ lines with vertical resizing
- Useful for longer responses or formatted text
Skip Incomplete Nodes
Description: When enabled, Auto Responder will not process or respond to messages from incomplete nodes.
Default: Disabled
What are incomplete nodes?: Nodes missing proper longName, shortName, or hwModel. On secure channels (custom PSK), this typically means we haven't received their encrypted NODEINFO packet - they may have just overheard traffic but aren't verified channel members.
When to enable:
- Using secure/encrypted channels with custom PSK
- Want bot functionality to only serve verified nodes
- Prevent external HTTP requests or script execution from unverified sources
Related: See Hide Incomplete Nodes for UI filtering, or Skip Incomplete Nodes for Auto Acknowledge.
Side Effects
- Network Traffic: Each triggered response generates mesh traffic
- Response Time: Text responses are sent immediately; HTTP requests depend on external service response time
- Privacy: Be cautious with HTTP requests - parameters from messages are sent to external services
- Rate Limiting: Consider implementing external rate limiting for HTTP webhooks
- Airtime Usage: Text responses consume airtime on the LoRa radio
Use Cases
Information Bots:
- Weather lookup:
weather {location}→ HTTP request to weather API - Node status:
status {nodeid}→ Text response with node information - Help command:
help→ Text response with available commands
Automation Triggers:
- Alert forwarding:
alert {message}→ HTTP webhook to notification service - Data logging:
log {sensor},{value}→ HTTP POST to logging service - Integration:
trigger {action}→ HTTP request to home automation
Interactive Commands:
- Greetings:
hello {name}→ Personalized welcome message - Pings:
ping→ "pong!" response - Info requests:
info {topic}→ Detailed information response
Best Practices
Pattern Design:
- Use descriptive parameter names (e.g.,
{location}not{x}) - Keep patterns simple and memorable
- Document your available commands somewhere accessible
- Avoid overlapping patterns that might cause confusion
Text Responses:
- Keep responses concise to minimize airtime usage
- Include parameter values to confirm what was matched
- Use multiline text for structured information
- Consider adding emojis for visual clarity
HTTP Requests:
- Validate external services are reliable and fast
- Use HTTPS for secure external communications
- Implement error handling on the receiving service
- Consider rate limiting to prevent abuse
- Test URLs before deploying to production
Security Considerations:
- Don't expose sensitive URLs or API keys in triggers
- Be aware that parameters come from untrusted user input
- Sanitize parameters on the receiving end for HTTP requests
- Consider what information you're sharing with external services
Network Impact:
- Limit number of triggers to avoid complexity
- Monitor for patterns that might match too frequently
- Consider disabling during high network activity periods
- Test thoroughly before enabling on production networks
Example Configurations
Simple Ping Bot:
Trigger: ping
Response Type: text
Response: pong!Weather Lookup:
Trigger: weather {city}
Response Type: http
Response: https://wttr.in/{city}?format=3Multi-Parameter Weather:
Trigger: w {city},{state}
Response Type: http
Response: https://api.weather.example.com/v1/current?city={city}&state={state}Help Command:
Trigger: help
Response Type: text
Response: Available commands:
- weather {location}
- w {city},{state}
- status {nodeid}
- pingNode Status:
Trigger: status {nodeid}
Response Type: text
Response: Looking up status for node {nodeid}...Troubleshooting
Triggers Not Matching:
- Check that patterns are spelled correctly
- Remember matching is case insensitive
- Verify parameters use
{paramName}format - Test with simple patterns first
Parameters Not Extracting:
- Ensure parameter names match between trigger and response
- Parameters must be surrounded by
{and} - Parameters cannot contain spaces
- Check for typos in parameter names
HTTP Requests Failing:
- Verify the URL is correct and accessible
- Check that parameters are properly URL-encoded
- Test the URL manually in a browser first
- Check external service logs for errors
Related Meshtastic Documentation
Auto Responder uses Meshtastic's messaging system. For more information:
Timer Triggers (Timed Events)
Schedule scripts to run automatically at specified times using cron expressions. This feature allows you to automate recurring tasks like sending daily status updates, weather reports, or network statistics to your mesh network.
How It Works
Timer Triggers execute scripts from /data/scripts/ on a schedule defined by cron expressions. When a timer fires, the associated script runs and its output is sent to a specified channel on your mesh network.
Configuration
Adding a Timer:
- Navigate to the Automation settings (Info tab)
- Scroll to the "Timed Events" section
- Fill out the timer configuration:
- Name: A descriptive name for your timer (e.g., "Daily Weather Report")
- Schedule: A cron expression defining when to run
- Script: Select a script from
/data/scripts/ - Channel: The channel to send script output to
- Click "Add Timer"
- Click "Save" to persist your changes
Timer Properties:
Each timer has:
- Name: Human-readable identifier for the timer
- Cron Expression: Standard 5-field cron format (minute hour day month weekday)
- Script: Path to the script in
/data/scripts/ - Channel: Channel index (0-7) where output is sent
- Enabled: Toggle to enable/disable individual timers
- Last Run: Timestamp of last execution (shown in timer list)
- Last Result: Success or error status of last execution
Cron Expression Format
Timer schedules use standard 5-field cron syntax:
┌───────────── minute (0-59)
│ ┌───────────── hour (0-23)
│ │ ┌───────────── day of month (1-31)
│ │ │ ┌───────────── month (1-12)
│ │ │ │ ┌───────────── day of week (0-6) (Sunday=0)
│ │ │ │ │
* * * * *Common Examples:
0 */6 * * *- Every 6 hours at minute 00 9 * * *- Every day at 9:00 AM30 8,20 * * *- 8:30 AM and 8:30 PM daily0 12 * * 1- Every Monday at noon0 0 1 * *- First day of every month at midnight*/15 * * * *- Every 15 minutes
Cron Helper: Use crontab.guru to build and validate cron expressions.
Script Requirements
Timer trigger scripts follow the same requirements as Auto Responder scripts:
- Located in
/data/scripts/directory - Supported extensions:
.js,.mjs,.py,.sh - Must output valid JSON to stdout with a
responseorresponsesfield - 30-second execution timeout
- Execute with container user permissions
- Script Arguments: Optional command-line arguments with token expansion
Script Arguments (Timer Triggers)
Timer triggers support passing command-line arguments to scripts via the Arguments field. Arguments support token expansion for dynamic values.
Example Arguments:
--ip {IP}- Pass the node IP address--count {NODECOUNT}- Pass the active node count--verbose --format json- Pass multiple flags
Available Tokens:
| Token | Description | Example |
|---|---|---|
{IP} | Meshtastic node IP | 192.168.1.100 |
{PORT} | Meshtastic TCP port | 4403 |
{VERSION} | MeshMonitor version | v3.4.0 |
{NODECOUNT} | Active node count | 42 |
{DIRECTCOUNT} | Direct node count | 15 |
{DURATION} | Server uptime | 2 days, 5 hours |
{FEATURES} | Enabled features | 🗺️ 🤖 |
Example Configuration:
Name: Scheduled Remote Admin
Schedule: 0 3 * * *
Script: remote-admin.py
Arguments: --ip {IP} --dest !abc12345 --reboot
Channel: 0 (Primary)This runs a remote admin command every day at 3 AM.
JSON Output Format:
Single Response:
{
  "response": "Your message text (max 200 chars)"
}Multiple Responses:
{
  "responses": [
    "First message",
    "Second message",
    "Third message"
  ]
}Example Timer Configurations
Daily Weather Report:
Name: Daily Weather
Schedule: 0 8 * * *
Script: weather.py
Channel: 0 (Primary)Sends weather information to the primary channel every morning at 8 AM.
Hourly Network Status:
Name: Network Stats
Schedule: 0 * * * *
Script: network-stats.js
Channel: 2 (LongFast)Reports network statistics every hour on the hour.
Weekly Summary:
Name: Weekly Summary
Schedule: 0 18 * * 0
Script: weekly-report.py
Channel: 0 (Primary)Sends a weekly summary every Sunday at 6 PM.
Example Scripts
Simple Status Script (status.js):
#!/usr/bin/env node

const now = new Date();
const response = {
  response: `Network status check: ${now.toLocaleString()}`
};

console.log(JSON.stringify(response));Weather Script (daily-weather.py):
#!/usr/bin/env python3
import json
import urllib.request

try:
    url = "https://wttr.in/YourCity?format=3"
    with urllib.request.urlopen(url, timeout=5) as response:
        weather = response.read().decode('utf-8').strip()
    output = {"response": weather}
except Exception as e:
    output = {"response": "Weather unavailable"}

print(json.dumps(output))Managing Timers
Enable/Disable: Click the "Enable" or "Disable" button on any timer to toggle its active state without removing it.
Edit Timer: Click "Edit" to modify any timer property, then "Save" to apply changes.
Remove Timer: Click "Remove" and confirm to delete a timer.
Save Changes: After adding, editing, or removing timers, click the "Save" button in the header to persist changes.
Side Effects
- Network Traffic: Each timer execution sends messages to the mesh network
- Airtime Usage: Timer outputs consume LoRa airtime
- Script Execution: Scripts run in the container with 30-second timeout
- Queue Processing: Multi-response scripts queue messages with 30-second intervals
Use Cases
- Scheduled Announcements: Daily mesh status updates or community messages
- Weather Reports: Automatic weather information at specified times
- Network Statistics: Periodic reports on node counts, connectivity, etc.
- Maintenance Reminders: Weekly or monthly maintenance notifications
- Data Collection: Scheduled sensor readings or API queries
- Heartbeat Messages: Regular "alive" messages to verify system operation
Best Practices
- Timing: Spread timers across different times to avoid congestion
- Frequency: Use appropriate intervals - hourly or daily for most use cases
- Script Testing: Test scripts manually via Auto Responder before scheduling
- Timezone: Cron expressions use the container's timezone (set via TZ environment variable)
- Logging: Check container logs (
docker logs meshmonitor) to monitor timer execution - Channel Selection: Choose appropriate channels for scheduled content
Troubleshooting
Timer Not Running:
- Verify the timer is enabled (green "ENABLED" badge)
- Check the cron expression with crontab.guru
- Ensure changes were saved (click "Save" in header)
- Check container logs for errors
Script Errors:
- Verify script exists in
/data/scripts/ - Ensure script has execute permissions (
chmod +x) - Check script outputs valid JSON format
- Review container logs for execution errors
Messages Not Appearing:
- Verify the selected channel is correct
- Check that the script returns a
responsefield - Ensure response text is under 200 characters
Geofence Triggers
Trigger automated actions when nodes enter, exit, or remain inside defined geographic areas. This powerful feature enables location-based automation such as arrival notifications, area monitoring, or proximity alerts.
How It Works
Geofence Triggers monitor node positions and compare them against defined geographic boundaries. When a node's position matches a trigger condition (entering, exiting, or remaining inside a zone), MeshMonitor automatically executes the configured response.
Configuration
Adding a Geofence Trigger:
- Navigate to the Automation settings (Info tab)
- Scroll to the "Geofence Triggers" section
- Fill out the trigger configuration:
- Name: A descriptive name for the trigger (e.g., "Base Camp Entry Alert")
- Shape: Circle or polygon defining the geographic boundary
- Event: When to trigger (entry, exit, or while inside)
- Node Filter: Which nodes to monitor (all or selected)
- Response Type: Text message or script
- Channel: Where to send the response (channel or direct message)
- Click "Add Geofence Trigger"
- Click "Save" to persist your changes
Geofence Shapes
Circle: Define a circular area by clicking on the map to set the center point and dragging to set the radius.
- Displays radius in kilometers
- Good for simple proximity monitoring
- Easy to visualize and adjust
Polygon: Define a custom-shaped area by clicking multiple points on the map to create vertices.
- Supports complex boundary shapes
- Useful for irregular areas like property boundaries
- Click points to add vertices, close the polygon to complete
The interactive map editor shows your current nodes with position data, making it easy to draw zones around specific locations.
Trigger Events
Entry: Fires when a node enters the geofence zone.
- Triggers once when position changes from outside to inside
- Useful for arrival notifications
Exit: Fires when a node leaves the geofence zone.
- Triggers once when position changes from inside to outside
- Useful for departure alerts
While Inside: Fires periodically while a node remains inside the zone.
- Configurable interval (in minutes)
- Useful for ongoing presence monitoring
- Example: Send status update every 5 minutes while node is in area
Node Filtering
All Nodes: Monitor all nodes with position data.
- Any node entering/exiting the zone triggers the action
Selected Nodes: Monitor only specific nodes.
- Choose which nodes to track from the node selector
- Filter by node name or ID
- Useful for monitoring specific assets or people
Response Types
Text Message: Send a customizable message with dynamic tokens.
Available tokens:
{GEOFENCE_NAME}- Name of the geofence trigger{EVENT}- Event type (entry/exit/while_inside){LONG_NAME}- Node's long name{SHORT_NAME}- Node's short name{NODE_ID}- Node's ID (e.g., !a1b2c3d4){NODE_LAT}- Node's latitude{NODE_LON}- Node's longitude{DISTANCE_TO_CENTER}- Distance to geofence center in kilometers{VERSION}- MeshMonitor version{NODECOUNT}- Total active nodes
Example Messages:
{LONG_NAME} entered {GEOFENCE_NAME}Alert: {SHORT_NAME} has left the monitored area{LONG_NAME} is {DISTANCE_TO_CENTER}km from base campScript Response: Execute a custom script for advanced logic.
- Scripts must be in
/data/scripts/directory - Supports Node.js, Python, and Shell scripts
- Receives geofence data via environment variables
- Same 30-second timeout as Auto Responder scripts
- Script Arguments: Optional command-line arguments with token expansion
Script Arguments (Geofence Triggers)
Geofence triggers support passing command-line arguments to scripts via the Arguments field. This is particularly useful with the remote-admin.py script for automated node management.
Example Arguments:
--reboot- Reboot node on geofence entry--set lora.region US- Change settings on exit--dest {NODE_ID} --reboot- Target the triggering node--ip {IP} --dest {NODE_ID} --factory-reset- Full reset with token expansion
Available Tokens:
| Token | Description | Example |
|---|---|---|
{NODE_ID} | Triggering node ID | !a1b2c3d4 |
{NODE_NUM} | Triggering node number | 123456789 |
{LONG_NAME} | Node's long name | Alice's Node |
{SHORT_NAME} | Node's short name | ALI |
{NODE_LAT} | Node's latitude | 40.7128 |
{NODE_LON} | Node's longitude | -74.0060 |
{GEOFENCE_NAME} | Geofence name | Base Camp |
{EVENT} | Event type | entry |
{DISTANCE_TO_CENTER} | Distance in km | 2.5 |
{IP} | Meshtastic node IP | 192.168.1.100 |
{PORT} | Meshtastic TCP port | 4403 |
{VERSION} | MeshMonitor version | v3.4.0 |
{NODECOUNT} | Active node count | 42 |
Example Configurations:
| Use Case | Script | Arguments |
|---|---|---|
| Reboot on entry | remote-admin.py | --reboot |
| Change region on exit | remote-admin.py | --set lora.region US |
| Set position | remote-admin.py | --setlat 40.7128 --setlon -74.0060 |
| Factory reset | remote-admin.py | --factory-reset |
| Custom with tokens | remote-admin.py | --dest {NODE_ID} --set device.role CLIENT |
Example: Reboot Node on Geofence Entry
Name: Reboot on Entry
Shape: Circle (500m radius)
Event: Entry
Response Type: Script
Script: /data/scripts/remote-admin.py
Arguments: --reboot
Channel: Direct MessageOutput Channel
Direct Message: Send the response directly to the triggering node.
- Private notification to the node owner
- Good for personal alerts
Channel: Send the response to a specific channel.
- Public notification visible to channel members
- Good for team/group awareness
Managing Triggers
Enable/Disable: Toggle individual triggers without removing them.
- Disabled triggers show reduced opacity
- Quick way to temporarily pause monitoring
Edit: Modify any trigger property.
- Click "Edit" to load trigger into the form
- Make changes and click "Save Changes"
- Click "Cancel" to discard changes
Remove: Delete a trigger permanently.
- Confirmation dialog prevents accidental deletion
Status Display: Each trigger shows:
- Shape type and size (e.g., "Circle (2.5 km)")
- Event type
- Response preview
- Node filter status
- Last run time and result (if applicable)
Side Effects
- Position Monitoring: Requires nodes to broadcast position data
- Processing Overhead: Each position update is checked against all active triggers
- Network Traffic: Text responses consume airtime on the mesh
- Script Execution: Scripts run in the container with timeout limits
Use Cases
Arrival/Departure Notifications:
- Alert when family members arrive home
- Notify team when assets reach destination
- Track vehicle entry/exit from facilities
Area Monitoring:
- Monitor restricted areas for unauthorized access
- Track node presence in work zones
- Event perimeter monitoring
Proximity Alerts:
- Warn when nodes approach hazardous areas
- Notify when nodes leave safe zones
- Distance-based status updates
Asset Tracking:
- Confirm delivery arrivals
- Monitor equipment location
- Track personnel in field operations
Best Practices
Zone Design:
- Use appropriate buffer zones to avoid edge-case triggers
- Consider GPS accuracy when sizing zones
- Test triggers with actual node movement
Performance:
- Limit number of active triggers for better performance
- Use node filtering when monitoring specific assets
- Choose appropriate "while inside" intervals
Notifications:
- Keep messages concise for radio efficiency
- Include relevant context (node name, location)
- Consider privacy when using public channels
Troubleshooting
Trigger Not Firing:
- Verify node has recent position data
- Check that node filter includes the target node
- Ensure trigger is enabled
- Verify geofence zone covers the expected area
False Triggers:
- GPS accuracy may cause edge-case triggers
- Increase zone size to add buffer
- Consider using "while inside" instead of entry/exit for stationary monitoring
Messages Not Sending:
- Check response text is under 200 characters
- Verify channel selection is correct
- Check for script errors in container logs
Auto Key Management
Automatically detects and repairs PKI (Public Key Infrastructure) key mismatches between nodes in your mesh network. Key mismatches can occur when a node's encryption key changes (e.g., after a factory reset or firmware update) but other nodes still have the old key cached. This prevents encrypted communication from working correctly.
How It Works
When enabled, MeshMonitor periodically scans for nodes with key mismatches and attempts to repair them by exchanging node info. The exchange process forces nodes to share their current encryption keys, resolving stale key caches.
The repair process for each node with a key mismatch:
- Detect: MeshMonitor identifies nodes whose cached public key doesn't match the key seen in recent packets
- Exchange: Sends a node info exchange request to trigger a fresh key exchange
- Verify: Waits for the exchange to complete and checks if the key mismatch is resolved
- Retry: If still mismatched, retries up to the configured maximum number of exchanges
- Purge (optional): If all exchanges fail and auto-purge is enabled, removes the node from the device database and sends one final exchange to re-establish the connection cleanly
Configuration
Navigate to Settings > Automation and find the Auto Key Management section.
Enable/Disable: Toggle the checkbox next to "Auto Key Management"
| Setting | Description | Default | Range |
|---|---|---|---|
| Enable | Turn auto key management on or off | Off | — |
| Interval Between Attempts | Time to wait between node info exchange attempts for each node (minutes) | 5 | 1–60 |
| Maximum Exchange Attempts | Number of node info exchanges to attempt before giving up on a node | 3 | 1–10 |
| Auto-Purge After Exhausting Attempts | If enabled, automatically remove the node from the device database after all exchange attempts fail, then send one final node info exchange | Off | — |
Activity Log
The Auto Key Management panel includes a real-time activity log showing recent repair activity:
- Time: When the action occurred
- Node: The node name or ID
- Action: What was attempted
- Exchange: A node info exchange was sent
- Fixed: The key mismatch was resolved
- Exhausted: All exchange attempts were used without resolving the mismatch
- Purge: The node was removed from the device database (when auto-purge is enabled)
- Status: Success or failure indicator
The log refreshes automatically every 30 seconds.
Side Effects
- Network Traffic: Each exchange attempt generates node info packets on the mesh
- Auto-Purge Risk: Enabling auto-purge will remove nodes from the device database if exchanges fail — the node will need to be re-discovered
- Background Processing: Runs on a timer; does not require user interaction after configuration
Use Cases
- Post-Firmware Update: Repair key mismatches after nodes update their firmware and regenerate keys
- Factory Reset Recovery: Automatically handle key changes when nodes are factory-reset
- Large Network Maintenance: Keep encryption keys current across a large mesh without manual intervention
- Security Hygiene: Ensure all nodes can communicate securely with current keys
Best Practices
- Start with the default 5-minute interval and 3 exchange attempts
- Enable auto-purge only if you're comfortable with nodes being temporarily removed and re-discovered
- Monitor the activity log after enabling to verify repairs are succeeding
- For more information about encryption keys and key mismatches, see Duplicate Encryption Keys
Related Documentation
- Duplicate Encryption Keys - Understanding key mismatches and how to fix them manually
- Security - Learn about node security and encryption
Auto Favorite
Automatically favorite nodes that are actively communicating with your mesh, ensuring important nodes are always pinned to the top of your node list without manual intervention.
How It Works
When enabled, MeshMonitor monitors incoming NodeInfo packets and automatically favorites nodes that meet eligibility criteria based on your local node's role. A periodic sweep runs every 60 minutes to unfavorite stale nodes that haven't been heard from within the configured staleness window.
Manual vs Auto Favorites
MeshMonitor distinguishes between manual and auto-managed favorites using a lock mechanism:
| Action | Favorite | Locked | Meaning |
|---|---|---|---|
| Manual favorite (click star) | Yes | Yes | Protected from automation |
| Manual unfavorite (click star) | No | Yes | Won't be re-auto-favorited |
| Auto-favorite (automation) | Yes | No | Can be swept when stale |
| Auto-sweep unfavorite | No | No | Available for re-auto-favorite |
Key behavior:
- Automation never changes manually locked favorites
- The lock icon (🔒/🔓) appears as a small subscript on the favorite star
- Click the lock to promote an auto-favorite to manual (locked), or release a manual favorite to automation (unlocked)
Configuration
Navigate to Settings > Automation and find the Auto Favorite section.
| Setting | Description | Default |
|---|---|---|
| Enable Auto Favorite | Toggle the feature on/off | Off |
| Stale Hours | Hours since last heard before a node is considered stale and unfavorited | 24 |
Eligibility Rules
Auto-favorite only runs at all when your local node's role is Router, Router_Late, or Client_Base. On any other local role (Client, Client_Mute, etc.) the feature stays inactive.
When active, it only auto-favorites a target node that is a 0-hop neighbor (hopsAway = 0) whose own role is a relay role:
| Target Node Role | Auto-Favorited? |
|---|---|
| Router | Yes (relay role) |
| Router_Late | Yes (relay role) |
| Client_Base | Yes (relay role) |
| Client | Never (does not relay) |
| Client_Mute | Never (does not relay) |
Client and Client_Mute nodes never relay traffic, so they are never auto-favorited regardless of your local node's role (issue #3774).
Targets must also:
- Be exactly 0 hops away (
hopsAway = 0) — direct RF neighbors only - Not have been heard via MQTT
- Not already be favorited
- Not have
favoriteLocked = true(manually managed)
Tip: On a
Client_Baselocal node, nearbyClient/Client_Mutedevices are intentionally skipped by auto-favorite. If you want those pinned, favorite them manually by clicking the star.
Permissions
- Viewing auto-favorite status requires
settings:readpermission - Modifying auto-favorite settings requires
settings:writepermission - Toggling favorite lock requires
nodes:writepermission
Troubleshooting
| Issue | Solution |
|---|---|
| Manually favorited node was unfavorited | Check if the lock icon shows unlocked — click it to lock |
| Node keeps getting re-favorited after manual unfavorite | Should not happen — manual unfavorite sets lock. Check if another user unlocked it |
| Auto-favorite not triggering | Verify feature is enabled and node meets eligibility criteria for your role |
Automatic Favorites Management (Remote)
Keeps the favorites list up to date on a remote infrastructure node you administer — preserving Meshtastic's zero-hop cost between favorited routers as your mesh grows, without site visits or blind CLI spamming.
This is distinct from Auto Favorite above: that feature manages favorites on your own locally-connected node. Automatic Favorites Management runs over Remote Admin and manages the favorites list on another node — typically a router or base station two hops away that you can't easily reach.
You configure it per target node in the Automatic Favorites Management section of the Remote Admin tab (select the target node, then scroll to the section).
How It Works
Each enabled target runs a "cycle" no more often than its configured interval (default 24 hours). A cycle:
- Discovers the target's direct neighbors from one or both sources:
- Use NeighborInfo — the nodes the target reports in its NeighborInfo broadcasts.
- Use Traceroutes — the nodes immediately adjacent to the target in any traceroute that passes through it.
- Filters the candidates to the configured eligible roles (default Router / Router Late / Client Base — the roles that benefit from zero-hop favoriting). The controlling (local) node is eligible too if it shows up as a direct neighbor.
- Favorites up to Maximum new neighbors per cycle newly-discovered nodes by sending
set-favoriteadmin commands to the target, and re-asserts up to Maximum re-favorite per cycle previously-assigned favorites.
Acknowledged, not blind
Favorite commands sent over Remote Admin request a response, so the target node returns a routing ACK. MeshMonitor captures it and shows the result per favorite:
- ✓ confirmed — the target received, authorized, and processed the command.
- ⏱ no ack — no acknowledgement arrived within the timeout (it may still have applied).
- ✕ <error> — the target rejected the command (e.g.
ADMIN_BAD_SESSION_KEY).
The same confirmation is shown as a toast on the manual Set Favorite / Remove Favorite buttons in Node Management.
Caveat: an ACK confirms the remote processed the request. If the favorited node is not yet in the remote node's database, the firmware accepts and ACKs the command but the favorite is a no-op there until that node is known. This is why the re-favorite pass exists — it re-sends previously assigned favorites (un-confirmed ones first) to recover any whose command was dropped or didn't stick.
Configuration
| Setting | Description | Default |
|---|---|---|
| Enable | Run discovery + favorite cycles for this target on the schedule below | Off |
| Use NeighborInfo | Discover neighbors from the target's NeighborInfo broadcasts (target must have the NeighborInfo module enabled) | On |
| Use Traceroutes | Discover neighbors from traceroutes that pass through the target | On |
| Cycle interval (hours) | How often to run a favorite cycle | 24 |
| Maximum neighbor age (hours) | Reuse an on-file NeighborInfo record newer than this instead of requesting a fresh one (0 = always request) | 24 |
| Maximum new neighbors per cycle | Cap on how many newly-discovered neighbors are favorited each cycle | 1 |
| Maximum re-favorite per cycle | How many previously-assigned favorites are re-asserted each cycle | 1 |
| Eligible neighbor roles | Which roles are favorited (multi-select) | Router, Router Late, Client Base |
A Run Cycle Now button triggers one cycle immediately for the selected target (useful for testing).
Requirements
- Remote Admin access to the target node (a session passkey is negotiated automatically; see Remote Admin Scanner).
- Local device firmware ≥ 2.7.0 (favorites support).
- For NeighborInfo discovery, the NeighborInfo module must be enabled on the target node.
Side Effects
- Heavy operation: each favorite is multiple packets per transaction (including a session-passkey handshake) plus a wait for the ACK. Keep the per-cycle limits low and the interval long, and use it sparingly.
- Airtime: discovery requests and favorite commands use admin-channel airtime on the path to the target.
Permissions
- Configuring Automatic Favorites Management requires admin access (the Remote Admin tab).
Ignored Nodes
Manages the persistent ignore list for nodes you want to exclude from your mesh monitoring. Ignored nodes are hidden from the node list and stay ignored permanently — whenever a listed node reappears without the ignore flag, MeshMonitor re-applies it automatically. This covers both inactive-node cleanup and the case where the device's own node database fills up and silently clears the ignore (see #2601).
How It Works
When you ignore a node (via the Node Details panel), MeshMonitor records it in a persistent ignore list. This section of the Automation tab shows all currently ignored nodes and allows you to manage the list.
Unlike simply hiding a node from the UI, the persistent ignore list ensures that:
- Survival across cleanup: If an inactive node is pruned from the database and later reappears, it will automatically be re-ignored
- Survival across device churn: Meshtastic devices hold a limited on-board ignore list; when their node database fills up they drop ignores and report the node as un-ignored. MeshMonitor treats its own list as authoritative and re-applies the ignore flag the next time the node is seen — both in its own database and on the locally-connected radio. The re-push to the radio is a local admin command (no destination), so it never generates mesh traffic; a short per-node cooldown prevents command storms if a device cannot durably hold the ignore
- Consistent filtering: Ignored nodes are hidden from the main Node List, advanced filters, and Admin Commands by default
- Network transparency: Ignoring a node is purely a UI action — it does not affect message delivery or mesh network functionality
Viewing Ignored Nodes
The Ignored Nodes panel displays:
- Total Count: A summary showing how many nodes are currently ignored
- Node Table: A detailed table with columns:
- Node ID: The hex ID of the ignored node (e.g.,
!a1b2c3d4) - Long Name: The node's long name (if known)
- Short Name: The node's short name (if known)
- Ignored At: When the node was added to the ignore list
- Actions: Un-ignore button to remove the node from the list
- Node ID: The hex ID of the ignored node (e.g.,
How to Ignore a Node
- Select a node in the Node List to open its details
- In the Node Details panel, click the Ignore Node button
- The node will be added to the persistent ignore list and hidden from the Node List
How to Un-ignore a Node
From the Automation tab:
- Navigate to Settings > Automation > Ignored Nodes
- Find the node in the table
- Click the Un-ignore button
From the Node List:
- Enable "Show ignored nodes" in the Node List filter panel (🚫 icon)
- Find the ignored node in the list and select it
- In the Node Details panel, click the Un-ignore Node button
Use Cases
- Noise Reduction: Hide spammy or malfunctioning nodes that clutter your node list
- Network Focus: Narrow monitoring to only the nodes you care about
- Persistent Exclusion: Ensure problematic nodes stay hidden even after database cleanup cycles
- Temporary Suppression: Hide nodes during troubleshooting, then un-ignore them later
Permissions
- Viewing the ignored nodes list requires
settings:readpermission - Ignoring or un-ignoring nodes requires appropriate admin permissions
Related Documentation
- Settings - Ignored Nodes Filter - UI filtering for ignored nodes in the Node List
- Admin Commands - Managing nodes through admin commands
Auto Heap Management
Automatically protects low-memory Meshtastic nodes from running out of heap by purging stale nodes and rebooting the device when free memory drops below a configurable threshold.
When enabled, MeshMonitor watches the heapFreeBytes value in LocalStats telemetry. If free heap falls below your configured threshold, it removes the 10 least-recently-heard nodes from the device database and triggers a reboot (~10 seconds disconnect, then automatic reconnect). A 30-minute cooldown prevents repeated triggers.
Most useful on nodes running MQTT, networking, and telemetry with 100+ nodes in the database — especially on LoRa32, T-Beam, and RAK4631 hardware.
See the full Auto Heap Management documentation for configuration details, threshold recommendations, target hardware, and FAQ.
Configuration Storage
All automation settings are stored on the MeshMonitor server and persist across container restarts and browser sessions. Changes made by any user with appropriate permissions will affect all users accessing the system.
Permissions
Modifying automation settings requires appropriate user permissions. Regular users may view automation status but cannot change settings without admin privileges.
Related Documentation
- Settings - Learn about general MeshMonitor settings
- Device Configuration - Configure your Meshtastic device
- Production Deployment - Best practices for production environments