
Settings
Reorganized in 4.0
In MeshMonitor 4.0 the old "Settings" tab was split in two:
- Global Settings — appearance, localization, security, notifications, backup, housekeeping. One per deployment.
- Per-Source Settings — connection, Virtual Node, auto-responder, auto-announce, auto-traceroute, auto-ack, scheduled messages, permissions. Edited in Dashboard → Sources → Edit Source. See Multi-Source.
This page covers the global options. Connection / Virtual Node / automation knobs now live on the source, not here.
The Global Settings page customizes MeshMonitor's appearance, localization, security defaults, and housekeeping behavior across the entire deployment. Open it from the gear icon in the dashboard sidebar (admin-gated).
Node Connection Configuration
4.0 — moved to per-source
Changing the address MeshMonitor connects to is now a per-source action. Open Dashboard → Sources → Edit Source to change host/port, device path, BLE ID, MQTT credentials, or MeshCore config for any source. The previous single-node "Change Connection" modal has been replaced by the Sources UI.
The MESHTASTIC_NODE_IP / MESHTASTIC_TCP_PORT env vars only bootstrap the first source on a fresh deployment — after first boot, edit the source.
See Multi-Source → Connection Types for the full list of supported source types (TCP, Serial, BLE, MQTT, MeshCore) and their configuration fields.
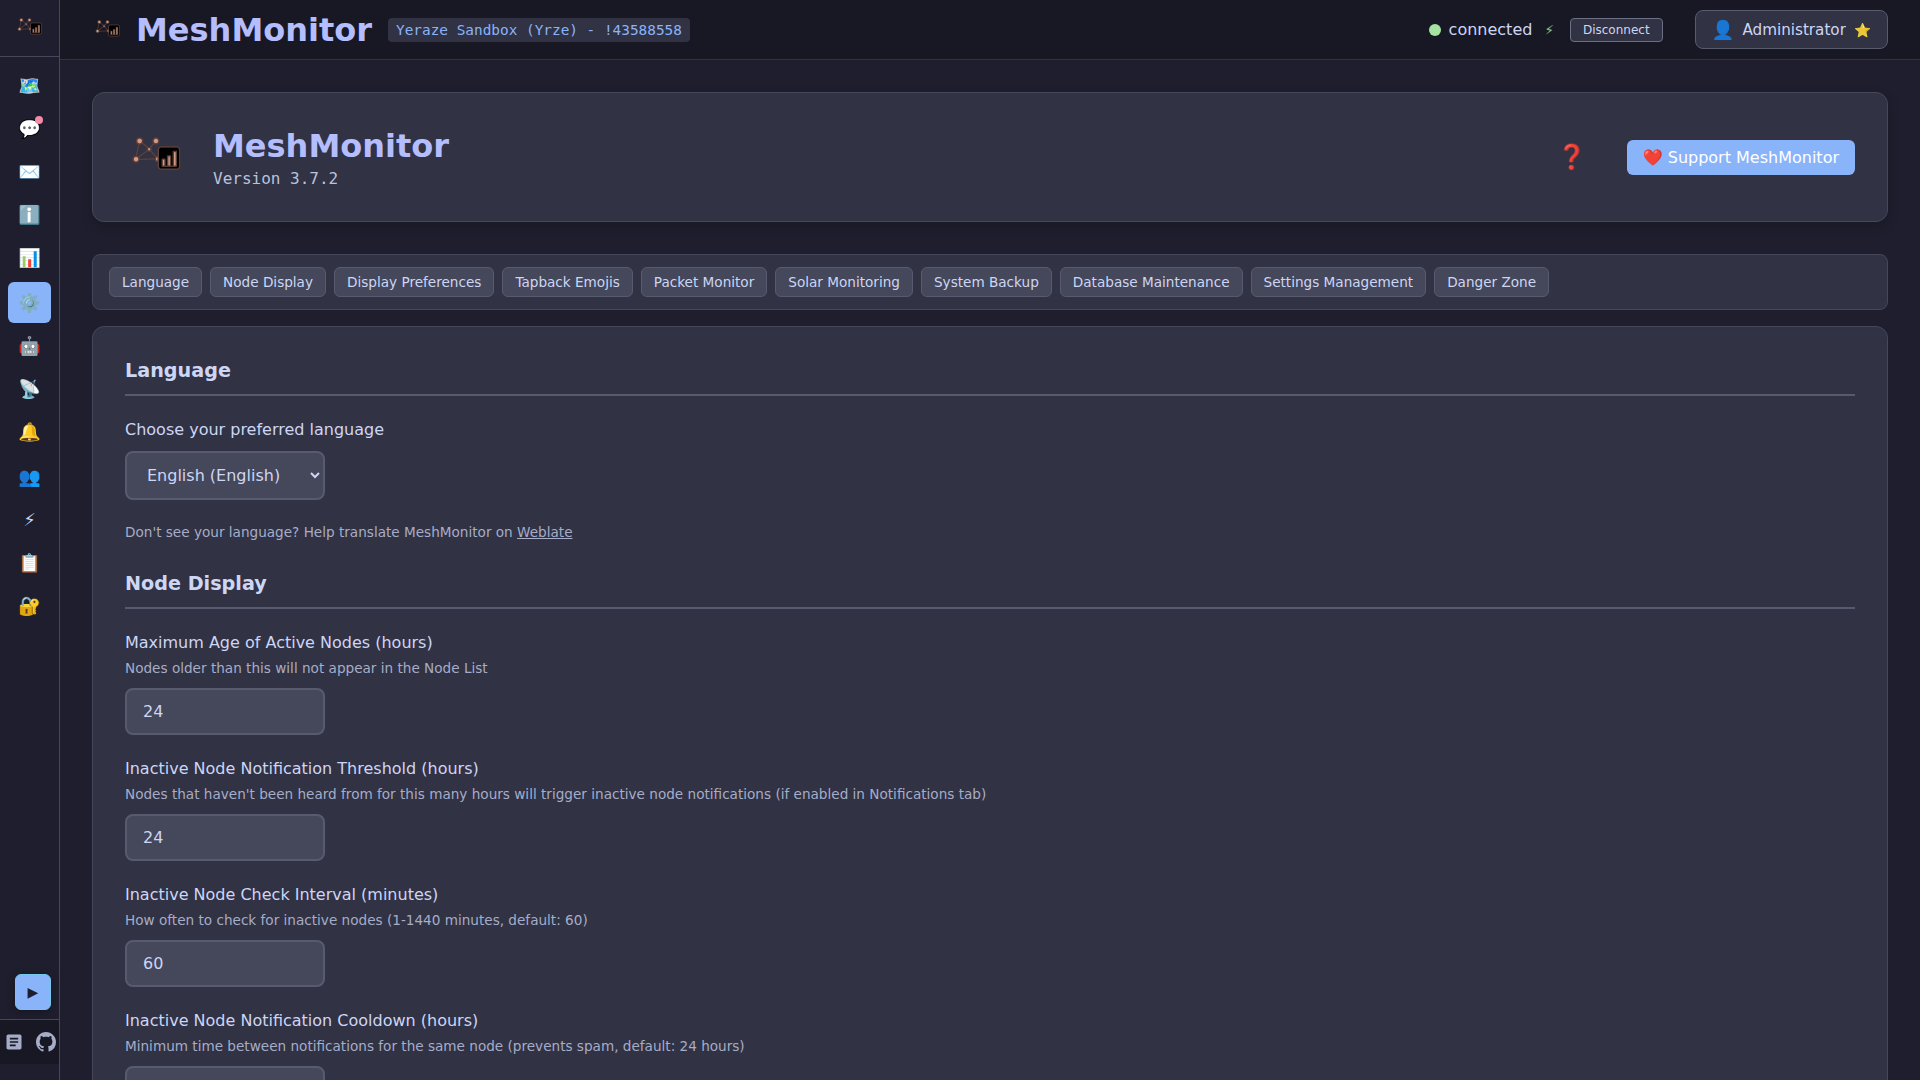
Node Display
Maximum Age of Active Nodes
Description: Controls which nodes appear in the Node List based on their last activity.
Range: 1-168 hours
Default: 24 hours
Effect: Nodes that haven't been heard from in longer than this period will not appear in the Node List. This helps keep the list focused on currently active nodes in your mesh network.
Side Effects: Setting this too low may cause frequently-active nodes to disappear from the list temporarily. Setting it too high may clutter the list with offline nodes.
Hide Incomplete Nodes
Description: Filters out nodes that haven't been fully verified on secure channels. Incomplete nodes are missing proper name or hardware information, which on encrypted channels indicates we haven't received their NODEINFO packet.
Location: Settings → Node Display, and Filter popup in Nodes/Messages tabs
Default: Disabled (show all nodes)
How it works: A node is considered "incomplete" when it's missing:
- A valid
longName(not just "Node !abc1234" format) - A valid
shortName - A valid
hwModel(hardware model)
Why this matters for secure channels: On channels with custom PSK encryption, NODEINFO packets (containing name and hardware info) are encrypted. If MeshMonitor can't decrypt a node's NODEINFO, we only see default values like "Node !abc1234". This means:
- Complete node = Successfully decrypted NODEINFO = Verified on the same channel
- Incomplete node = No NODEINFO received = May have just overheard encrypted traffic
Effect: When enabled, incomplete nodes are hidden from:
- Node List (Nodes tab)
- Messages tab node list and recipient dropdown
- Filter popup shows checkbox with secure channel recommendation
Auto-behavior: When filtering by a secure channel (custom PSK), the filter popup automatically enables "Hide incomplete nodes" as a recommended default.
Use Cases:
- Secure mesh deployments where you only want to see verified channel members
- Filtering out nodes that may have overheard traffic but aren't on your encrypted channel
- Reducing clutter from unconfigured or unknown devices
Related Settings: See Skip Incomplete Nodes for Automation to prevent auto-ack and auto-responder from responding to incomplete nodes.
Unknown Nodes Filter
Description: Allows you to filter nodes that have no identifying name information. Unknown nodes are those without both a long name and short name, typically displayed as "Node 12345678" in the interface.
Location: Node List filter panel (identified by ❓ icon)
Filter Modes:
- Show only: Display only unknown nodes (useful for identifying devices that need configuration)
- Hide matching: Hide unknown nodes from the list (default behavior, keeps the list clean)
How it works: A node is considered "unknown" when it has no long name AND no short name (or both are empty/whitespace). This commonly happens with:
- Newly added devices that haven't been configured yet
- Devices reset to factory defaults
- Nodes that haven't broadcast their user information
Use Cases:
- Identifying unconfigured nodes in your network
- Cleaning up the node list to show only properly configured devices
- Finding devices that may need attention or setup
Effect: When combined with other filters, this helps manage large mesh networks by focusing on nodes with meaningful identification or highlighting those that need configuration.
Device Role Filter
Description: Filter nodes based on their assigned Meshtastic device role, allowing you to focus on specific types of nodes in your network.
Location: Node List filter panel and Telemetry Dashboard
Filter Modes:
- Show only: Display only nodes with selected roles
- Hide matching: Hide nodes with selected roles from the list
Available Roles:
- CLIENT: Standard end-user devices (most common)
- CLIENT_MUTE: Receives messages but doesn't route
- ROUTER: Dedicated routing nodes
- ROUTER_CLIENT: Routes traffic and used by user
- REPEATER: Dedicated message repeaters
- TRACKER: GPS tracker devices
- SENSOR: Environmental sensor nodes
- TAK: Team Awareness Kit integration
- CLIENT_HIDDEN: Hidden client nodes
- LOST_AND_FOUND: Lost and found trackers
- TAK_TRACKER: TAK-enabled trackers
Use Cases:
- View only routing infrastructure (ROUTER, REPEATER roles)
- Focus on end-user devices (CLIENT roles)
- Monitor specialized nodes (SENSOR, TRACKER roles)
- Analyze network topology by node function
- Create focused views for network management
Effect: Helps organize and analyze large networks by grouping nodes by their functional role in the mesh.
Ignored Nodes Filter
Description: Filter nodes that you have manually marked as "ignored." Ignored nodes are hidden from the node list by default to reduce clutter from nodes you don't want to track.
Location: Node List filter panel (identified by 🚫 icon)
Default: Unchecked (ignored nodes are hidden)
Behavior:
- Unchecked (default): Ignored nodes are hidden from the node list
- Checked: Ignored nodes are shown in the node list
How to Ignore a Node:
- Select a node in the Node List to open its details
- In the Node Details page, click the "Ignore Node" button (next to "Purge Data")
- The node will be marked as ignored and hidden from the list
How to Un-ignore a Node:
- Enable "Show ignored nodes" in the filter panel
- Find the ignored node in the list and select it
- In the Node Details page, click the "Un-ignore Node" button (green button)
- The node will be unmarked and appear normally
Use Cases:
- Hide nodes you're not interested in tracking (e.g., nodes outside your area of interest)
- Reduce clutter in large mesh networks
- Temporarily hide problematic nodes while troubleshooting
- Focus on a subset of nodes that matter to you
Effect: Ignored nodes are hidden from the main Node List by default. They continue to receive data and can be shown again at any time by enabling the "Show ignored nodes" filter. This is a per-node setting stored in the database.
Note: Ignoring a node does not affect message delivery or network functionality - it only hides the node from the UI.
Security Filter
Description: Filter nodes based on detected security issues, allowing you to focus on nodes with security problems or hide them from view.
Location: Filter Modal popup (click "Filter" button in Nodes or Messages tab sidebar)
Filter Options:
- All Nodes: Show all nodes regardless of security status (default)
- ⚠️ Flagged Only: Display only nodes with detected security issues
- Hide Flagged: Hide all flagged nodes from the list
Security Issues Detected:
- Low-Entropy Keys: Nodes using known weak public encryption keys
- Duplicate Keys: Multiple nodes sharing the same public key
Use Cases:
- Security audits: View all nodes with potential security vulnerabilities
- Clean view: Hide problematic nodes to focus on trusted devices
- Network monitoring: Quickly identify new security issues as they're detected
- Compliance: Ensure all nodes meet security standards
Visual Indicators:
- Flagged nodes display a ⚠️ warning icon in the node list
- Messages from flagged nodes show a red warning bar with details
- Hovering over warning icons shows specific security issue details
Effect: When "⚠️ Flagged Only" is selected, the node count updates to show "X/Total" format (e.g., "8/156 nodes"). This filter works alongside other filters (text search, device role, unknown nodes) and applies to both Nodes and Messages tabs.
Learn More: See Security Features for detailed information about security monitoring, detection methods, and best practices.
Node Details Block
Location: Messages page, displayed when a node is selected in the conversation list
The Node Details block provides comprehensive information about the currently selected node, displaying real-time metrics and device information in an easy-to-read format.
Information Displayed
Node Identification
Node ID (Hex): Node identifier in hexadecimal format (e.g.,
0x43588558)- Standard Meshtastic node ID format
- Used in URLs and API calls
- Matches the format displayed in the Meshtastic app
Node ID (Decimal): Same identifier in decimal format (e.g.,
1129874776)- Useful for debugging and database queries
- Alternative format for different use cases
Power Status
- Battery Level: Current battery percentage (0-100%)
- Color-coded indicators:
- 🟢 Green: >75% (good)
- 🟡 Yellow: 25-75% (moderate)
- 🔴 Red: <25% (low)
- Shows voltage in parentheses (e.g., "85% (4.15V)")
- Color-coded indicators:
Network Quality
Signal (SNR): Signal-to-Noise Ratio in decibels
- Color-coded quality indicators:
- 🟢 Green: >10 dB (excellent)
- 🟡 Yellow: 0-10 dB (good)
- 🔴 Red: <0 dB (poor)
- Color-coded quality indicators:
Signal (RSSI): Received Signal Strength Indicator in dBm
- Shows absolute signal strength
- Lower (more negative) values indicate weaker signal
Signal Trend ▲/→/▼ (New in 4.13): A derived "is this link getting worse?" indicator, distinct from the Link Quality score. It compares the last 24 hours of RSSI (or SNR, when RSSI history is too sparse) against the preceding 7-day baseline: Improving (▲), Stable (→), or Degrading (▼). Hover the badge for the underlying dB deltas. When the drop is attributable to a rising noise floor rather than the link itself, the tooltip calls that out explicitly. Only shown once enough history exists to say something meaningful.
Noise Floor (New in 4.13): The node's self-reported RF noise floor in dBm, shown alongside RSSI/SNR when the device provides it.
Network Performance
Channel Utilization: Percentage of airtime used by all nodes
- Helps identify network congestion
- Values >75% may indicate overcrowded channel
Air Utilization TX: This node's transmission airtime percentage
- Shows how much this specific node is transmitting
- Useful for identifying chatty nodes
Device Information
Hardware Model: Device type with friendly name
- Displays official Meshtastic hardware names (e.g., "STATION G2", "HELTEC V3")
- Shows hardware images when available (70+ device types supported)
- Hardware images fetched from Meshtastic web-flasher repository
Role: Device role in the mesh network
- CLIENT: End-user device (most common)
- CLIENT_MUTE: Receives but doesn't route
- ROUTER: Dedicated routing node
- ROUTER_CLIENT: Routes and used by user
- REPEATER: Dedicated repeater
- TRACKER: GPS tracker device
- SENSOR: Sensor node
- And more specialized roles
Firmware Version: Current Meshtastic firmware version
- Displays version string (e.g., "2.3.2.d1e2f3a")
- Useful for troubleshooting compatibility issues
Network Position
Hops Away: Number of hops from your node
- "Direct": Node is directly reachable
- Number (e.g., "2 hops"): Requires intermediate nodes
Via MQTT: Indicates if node connected via MQTT bridge
- Shows when node is reachable through MQTT instead of radio
Location (New in 4.13)
- Position: The node's latitude/longitude as plain text (5 decimal places) — shown so a bad fix (e.g.
0.00000, 0.00000) is visible at a glance without opening the map - Elevation: The node's reported GPS altitude in meters
Activity
- Last Heard: When the node was last active
- Relative time format (e.g., "5 minutes ago", "2 hours ago")
- Uses your configured time/date format preferences
Layout
The Node Details block uses a responsive grid layout:
- Desktop: 2-column grid for efficient space usage
- Mobile: Single column for better readability on small screens
Missing Data
When information is unavailable, the block displays "N/A" for that metric. This commonly occurs when:
- Node hasn't transmitted certain telemetry data yet
- Information isn't available from the device type
- Connection was lost before all data was received
Solar Monitoring
Description: Configure solar production monitoring to visualize expected solar power generation on telemetry graphs.
Integration: Uses the forecast.solar API to fetch solar production estimates based on your panel configuration and location.
Configuration Parameters:
Latitude
- Range: -90 to 90 degrees
- Description: Geographic latitude of your solar installation
- Examples:
- 37.7749 (San Francisco, CA)
- 51.5074 (London, UK)
- -33.8688 (Sydney, Australia)
Longitude
- Range: -180 to 180 degrees
- Description: Geographic longitude of your solar installation
- Examples:
- -122.4194 (San Francisco, CA)
- -0.1278 (London, UK)
- 151.2093 (Sydney, Australia)
Declination (Tilt)
- Range: 0-90 degrees
- Description: The angle your solar panels are tilted from horizontal
- Values:
- 0° = Horizontal (flat mounting)
- 20-40° = Typical roof mount (varies by latitude)
- 90° = Vertical (wall mounting)
- Tip: Use a protractor or angle finder to measure your panel tilt
Azimuth (Compass Direction)
- Range: 0-360 degrees
- Description: Compass direction your solar panels face
- Values:
- 0° = North
- 90° = East
- 180° = South (optimal in Northern Hemisphere)
- 270° = West
- Tip: Use a compass app on your phone to determine panel orientation
Effect: When configured, MeshMonitor will automatically fetch solar production estimates every hour and display them as translucent yellow overlays on telemetry graphs.
Visual Indicator: Solar estimates appear as a yellow background on:
- Node Details telemetry graphs
- Telemetry Dashboard charts
- Any time-series telemetry visualization
Side Effects:
- Hourly API requests to forecast.solar (free tier)
- Additional database storage for solar estimates
- Minimal performance impact on graph rendering
When to use:
- Off-grid or solar-powered Meshtastic deployments
- Battery optimization and planning
- Correlating node performance with available solar power
- Predicting when nodes may go offline due to insufficient power
Learn More: See Solar Monitoring for detailed documentation, API endpoints, and troubleshooting.
Map Settings
Discard Invalid Positions
New in 4.13
Description: Controls whether GPS fixes reported at Null Island (0, 0) — including precision-obscured positions that snap to that grid cell — are discarded or kept.
Default: Enabled (discard)
Effect: When enabled (default), a (0,0) position is dropped on ingest, across every source, and never stored. Disable it to store and display these positions as received — useful if you want to identify which nodes are transmitting bad/unset GPS fixes. Out-of-range or otherwise garbage coordinates (NaN, outside ±90/±180°) are always discarded regardless of this setting.
Location: Settings → Map Settings
Map Tileset Selection
Description: Choose which map tile server to use for displaying your mesh network on the interactive map.
Per-theme selection (New in 4.13)
The tileset is now chosen separately for light and dark appearance — a Light Mode Tileset and a Dark Mode Tileset, each applied automatically when the matching color theme is active. Existing single-tileset selections were preserved for both slots on upgrade.
Default Tilesets:
- OpenStreetMap (default) - Standard OSM map style
- OpenStreetMap HOT - Humanitarian OpenStreetMap Team style
- CartoDB Dark - Dark mode map style
- CartoDB Light - Light mode map style
- OpenTopoMap - Topographic map with terrain details
- ESRI Satellite - Satellite imagery
Location:
- Settings Tab: Map Settings section (Light Mode Tileset / Dark Mode Tileset)
- Nodes Tab: Bottom-center tileset selector (visual picker) — updates whichever slot matches your current appearance
Effect: Changes the base map layer displayed on the interactive map. Different tilesets offer different visual styles, levels of detail, and use cases.
Use Cases:
- OpenStreetMap: General-purpose mapping with street and place names
- Satellite: Identify terrain features and physical landmarks
- Topographic: Outdoor deployments needing elevation and terrain data
- Dark/Light: Match your application theme for visual consistency
Custom Tile Servers
Description: Configure custom map tile servers for offline operation, custom styling, or organizational branding.
Features:
- Offline Operation - Use locally hosted tiles without internet access
- Privacy - No third-party requests that could leak node locations
- Custom Branding - Organization-specific map styles
- High Availability - Independence from external tile services
Configuration:
- Navigate to Settings → Map Settings → Custom Tile Servers
- Click + Add Custom Tile Server
- Configure:
- Name: Friendly name (e.g., "Local Tiles")
- Tile URL: URL template with
{z}/{x}/{y}placeholders - Attribution: Attribution text for the map source
- Max Zoom: Maximum zoom level (1-22)
- Description: Optional description
- Click Save
- Select your custom tileset from the map tileset dropdown
URL Format: Custom tile servers must use the standard XYZ tile format:
https://example.com/{z}/{x}/{y}.pngRequired Placeholders: {z} (zoom), {x} (tile X), {y} (tile Y)
Optional Placeholders: {s} (subdomain for load balancing)
Supported Formats:
- PNG (
.png) - Best quality, larger file size - JPEG (
.jpg,.jpeg) - Good for satellite imagery - WebP (
.webp) - Smaller file size, modern browsers
Validation:
- Max 50 custom tilesets per instance
- URL length limit: 500 characters
- Name length limit: 100 characters
- Attribution length limit: 200 characters
- Zoom range: 1-22
Security:
- HTTPS recommended for production
- HTTP allowed for localhost/127.0.0.1 only
- Custom tile servers must allow CORS (Cross-Origin Resource Sharing)
Example Configuration:
Name: Local OSM
URL: http://localhost:8080/styles/osm-bright/{z}/{x}/{y}.png
Attribution: © OpenStreetMap contributors
Max Zoom: 18
Description: Offline OpenStreetMap tiles via TileServer GLLearn More: See Custom Tile Servers for detailed setup instructions, TileServer GL integration, and troubleshooting.
Elevation / Terrain (Link Profile)
Description: Controls the digital elevation model (DEM) source that powers the Map Analysis Link Profile tool — the two-point terrain/line-of-sight/Fresnel-zone link-planning tool. Admin-only settings; visible under Settings → Elevation / Terrain.
Fields:
- Enable terrain elevation — turns the Link Profile tool's terrain chart on or off. When disabled, the toolbar button disappears from Map Analysis for every user and any in-flight request returns an explicit "disabled" message rather than failing silently. Enabled by default.
- Elevation Source URL — an optional custom DEM source. Leave empty to use the default: the public AWS/Mapzen "Terrarium" tile set (
elevation-tiles-prod.s3.amazonaws.com), a free, no-API-key, SRTM-derived dataset. Treated as a server-side secret (like the Apprise API Server URL) — it's never sent to the browser except back to an admin who already hassettings:write, since it may embed an API key.
Source auto-detection: the URL you enter is auto-detected as one of two shapes:
- A tile-template URL containing
{z},{x}, and{y}placeholders — sampled and decoded the same way as the default Terrarium source. - An Open-Topo-Data-compatible JSON point API — queried in batches instead of tiles.
Test button: probes the configured URL server-side and reports the detected source type, a sample elevation (queried near Mount Everest's summit by default, to distinguish a working provider from a source that just returns 0 for everything), and the round-trip latency — without needing to pick two points on the map first. With the URL field empty, it probes the default Terrarium source and labels the result "(default source)", so you can verify the out-of-the-box configuration too.
Notes:
- All elevation fetches happen server-side through the same SSRF-guarded outbound-request path used elsewhere in MeshMonitor — the browser never talks to the DEM source directly, and a custom source URL can't be used to probe your internal network.
- Elevation data is source-agnostic: it isn't tied to any particular Meshtastic/MeshCore/MQTT source, so this is a single server-wide setting, not a per-source one.
- Implausible DEM samples (below −500 m or above 9000 m — an artifact of open-water/void pixels in some tile sets, not real terrain) are discarded server-side and shown as gaps in the Link Profile chart rather than distorting it.
- The
POST /api/elevation/profileendpoint used by the tool is public (unauthenticated) but rate-limited to 20 requests/minute per IP in production (requests from private/internal IPs are exempt); the Test button's endpoint requiressettings:write.
Also powers the 3D terrain view (New in 4.14)
This same elevation source drives Map Analysis's 3D terrain view. A tile-template URL (the default Terrarium source, or a custom one) works for both the 2D Link Profile chart and the 3D pitched-terrain map. A JSON point API source only supports the 2D Link Profile — there are no tiles to build a 3D surface from, so the 3D toggle stays disabled with an explanatory tooltip for that configuration (no fallback to the default tile source is attempted).
Display Preferences
Default Landing Page
New in 4.2.2
Admin-only setting that controls where users land at the root URL (/).
Description: Choose what every user sees when they open MeshMonitor at the root URL — the unified multi-source dashboard, or one specific source's view.
Options:
- Unified View (default) — current behavior; the multi-source dashboard with all sources side-by-side
- Any configured source —
/redirects to/source/:sourceId/so the page opens straight into that source
Location: Settings → Appearance → Default Landing Page (admin-only — non-admin users do not see this control).
Effect: Sets a deployment-wide default. Users still have full navigation:
- The Sources button in any source view always returns to the unified dashboard
- The Back to Sources buttons on Unified Messages and Unified Telemetry always return to the unified dashboard
- If the configured source is later deleted or otherwise unreachable, the redirect falls back to the unified view
Use Cases:
- Single-source deployments — bypass the unified dashboard and land users directly on the only source they care about
- Multi-source deployments with a primary node — keep visitors focused on the main mesh while still allowing drill-down into others
Preferred Node List Sorting
Field Options: Long Name, Short Name, ID, Last Heard, SNR, Battery, Hardware Model, Hops
Direction Options: Ascending (A-Z, 0-9, oldest-newest) or Descending (Z-A, 9-0, newest-oldest)
Default: Long Name (Ascending)
Effect: Sets the default sorting for the Node List on the main page. Users can still manually sort the list, but it will return to this default on page reload.
Time Format
Options: 12-hour (e.g., 3:45 PM) or 24-hour (e.g., 15:45)
Default: 24-hour
Effect: Changes how times are displayed throughout the application in messages, telemetry, and other time-based information.
Date Format
Options:
- MM/DD/YYYY (e.g., 12/31/2024)
- DD/MM/YYYY (e.g., 31/12/2024)
- YYYY-MM-DD (e.g., 2024-12-31) - ISO 8601 standard
Default: MM/DD/YYYY
Effect: Changes how dates are displayed throughout the application.
Temperature Unit
Options: Celsius (°C) or Fahrenheit (°F)
Default: Celsius
Effect: Changes how temperature readings from environmental sensors are displayed in telemetry graphs and node details.
Side Effects: Only affects display - the actual telemetry data stored in the database remains unchanged.
Distance Unit
Options: Kilometers (km) or Miles (mi)
Default: Kilometers
Effect: Changes how distances are displayed when viewing node locations and calculating ranges between nodes.
Side Effects: Only affects display - the actual position data remains unchanged.
Color Theme
Description: Customize the visual appearance of MeshMonitor with 15 carefully crafted themes including accessibility-focused options.
Categories:
- Catppuccin (4 themes): Latte, Frappé, Macchiato, Mocha
- Popular Themes (6 themes): Nord, Dracula, Solarized Dark/Light, Gruvbox Dark/Light
- High Contrast (2 themes): WCAG AAA compliant themes for users with low vision
- Color Blind Friendly (3 themes): Optimized for protanopia, deuteranopia, and tritanopia
Default: Catppuccin Mocha (Dark)
Effect: Changes the color scheme for all UI elements including:
- Sidebar and navigation
- Message containers and chat
- Telemetry graphs and charts
- Node information displays
- Settings and configuration panels
- Modals and popups
Accessibility Features:
- WCAG AAA Compliance: High Contrast themes meet the highest accessibility standards
- Color Blind Support: Specialized themes for different types of color blindness
- Persistent Choice: Your theme selection is saved and applies across all pages
- Instant Switching: Themes update immediately without page reload
Learn More: Browse all themes with color previews and detailed descriptions in the Theme Gallery.
Telemetry Visualization Hours
Description: Controls how much historical telemetry data is shown in graphs.
Range: 1-168 hours
Default: 24 hours
Effect: Adjusts the time window for telemetry graphs showing battery levels, voltage, temperature, and other sensor data.
Side Effects: Larger values may result in slower graph rendering if you have many nodes with frequent telemetry updates.
Telemetry Dashboard
The Telemetry Dashboard provides customizable monitoring of your mesh network with drag-and-drop widgets. Access it via the Telemetry tab in the main navigation.
Adding Widgets
Click the + button in the dashboard header to add new widgets. Two widget types are available:
Node Status Widget
Description: A table widget for monitoring the status of multiple nodes at a glance.
Features:
- Displays Node Name, Last Heard time, and Hops Away
- Support for multiple nodes in a single widget
- Search functionality to add nodes to the list
- Sort by Last Heard time (most recent first)
- Individual node removal via the × button
Adding Nodes:
- Click in the "Add node..." search field
- Type to filter available nodes by name or ID
- Click a node in the dropdown to add it
- Repeat to add additional nodes
Use Cases:
- Monitor a group of remote nodes at once
- Track when specific nodes were last active
- Identify nodes that may have connectivity issues
- Keep tabs on infrastructure nodes (routers, repeaters)
Traceroute Widget
Description: Displays the last successful traceroute results to and from a selected node.
Features:
- Shows the forward path (from your node to the target)
- Shows the return path (from the target back to your node)
- Displays SNR values for each hop when available
- Shows the timestamp of the last traceroute
- Supports a single target node per widget
Selecting a Node:
- Click in the "Select a node..." search field
- Type to filter available nodes by name or ID
- Click a node to display its traceroute information
Information Displayed:
- Forward Path: The route your messages take to reach the target node, showing each hop with signal quality
- Return Path: The route used for return messages, which may differ from the forward path
- SNR (Signal-to-Noise Ratio): Displayed in dB for each hop when available, helping identify weak links
Use Cases:
- Understanding network topology and message routing
- Identifying problematic links in the mesh
- Comparing signal quality across different paths
- Troubleshooting connectivity issues with specific nodes
Widget Management
Drag and Drop: All widgets (telemetry charts, Node Status, and Traceroute) can be reordered by dragging the ⋮⋮ handle in the widget header.
Removing Widgets: Click the × button in the widget header to remove it from the dashboard.
Persistence: Widget configurations (including selected nodes and order) are automatically saved and restored when you return to the dashboard.
Settings Management
Save Settings
Saves all changes made in the Settings tab. Changes are not applied until you click this button.
Side Effects: Settings are stored on the server and will affect all browsers accessing this MeshMonitor instance.
Reset to Defaults
Restores all settings to their default values:
- Max Node Age: 24 hours
- Temperature Unit: Celsius
- Distance Unit: Kilometers
- Telemetry Hours: 24
- Preferred Sort: Long Name (Ascending)
- Time Format: 24-hour
- Date Format: MM/DD/YYYY
Side Effects: This affects all browsers accessing this MeshMonitor instance and cannot be undone.
Danger Zone
These actions are irreversible and can result in data loss. Use with extreme caution.
Erase Node List
Description: Removes all nodes and traceroute history from the database.
Effect: Clears the entire node database and triggers a node refresh to repopulate the list from the connected Meshtastic device.
Side Effects:
- All node information will be permanently deleted
- All traceroute history will be permanently deleted
- The page will automatically refresh after purging
- New nodes will be discovered as they broadcast on the mesh
When to use: When you want to start fresh, have moved to a different mesh network, or need to clean up corrupted node data.
Purge Telemetry
Description: Removes all historical telemetry data from the database.
Effect: Deletes battery, voltage, temperature, humidity, pressure, and other environmental sensor readings.
Side Effects:
- All telemetry graphs will show no historical data
- Current node states (latest battery, voltage, etc.) are preserved
- New telemetry will continue to be collected normally
- The page will automatically refresh after purging
When to use: When your database has grown too large or you want to start fresh telemetry collection.
Purge Messages
Description: Removes all messages from the database.
Effect: Deletes all channel messages and direct message conversations.
Side Effects:
- All message history is permanently lost
- Message search will return no results
- New messages will continue to be received normally
- The page will automatically refresh after purging
When to use: When you need to clear sensitive message history or reduce database size.
Restart Container / Shutdown MeshMonitor
Description: Restarts the MeshMonitor container (Docker) or shuts down the application (bare metal).
Effect:
- Docker: The container restarts automatically and will be unavailable for approximately 10-30 seconds
- Bare Metal: MeshMonitor shuts down and must be manually restarted
Side Effects:
- All active connections will be disconnected
- The web interface will be temporarily unavailable
- Running background tasks (traceroutes, announcements) will be interrupted
- After restart (Docker only), the page should reload automatically
When to use: When applying configuration changes that require a restart, troubleshooting connection issues, or performing maintenance.
Related Documentation
- HTTP vs HTTPS Configuration - Learn about the
COOKIE_SECUREsetting for authentication - Production Deployment - Best practices for production environments
- Reverse Proxy - Configure NGINX, Traefik, or Caddy